In part 1 of this series we analyzed how free throw shooting translates from college to the NBA. In part 2 we analyzed how three point shooting translates. In this third and final part we’ll look at how field goal percentages translate from college to the NBA.
4. Relationship Between College FG% and NBA FG%
Similar to the previous parts in this series, we’ll only consider players who have shot a significant amount of field goals in their college and NBA careers. We require that players have attempted at least 60 field goals in college and 200 in the NBA.
4.1 NBA FG% vs College FG%
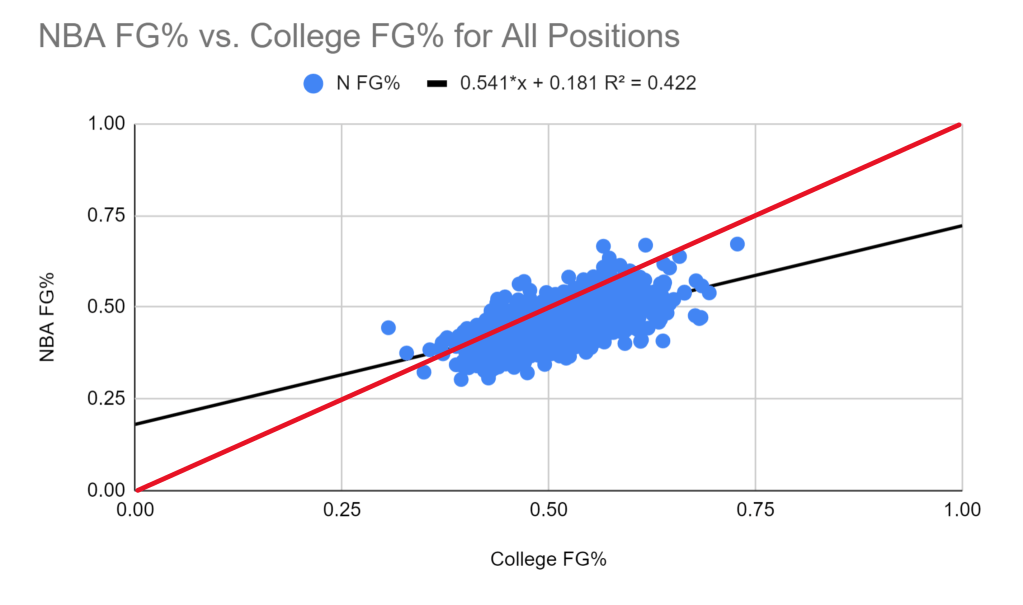
Originally, with free throws, we saw most players place above the red line, meaning they improved their percentages after entering the NBA. Then, with three pointers, most players, about 67%, had worse 3P% in the NBA. Now, with field goals, we see by far the worst regression. 88% of players have worse FG% in the NBA. This is likely due to the increased skill level of the NBA, as the average NBA player was elite in college and probably had a much easier time scoring against his opponents. The R2 value of .422 is a little less than that for free throws, but it is significantly greater than that for threes, indicating that there is still a significant correlation between college FG% and NBA FG%.
To better visualize the distribution of how players are getting better/worse, we can look at a histogram of the difference between a player’s NBA FG% and their College FG%:
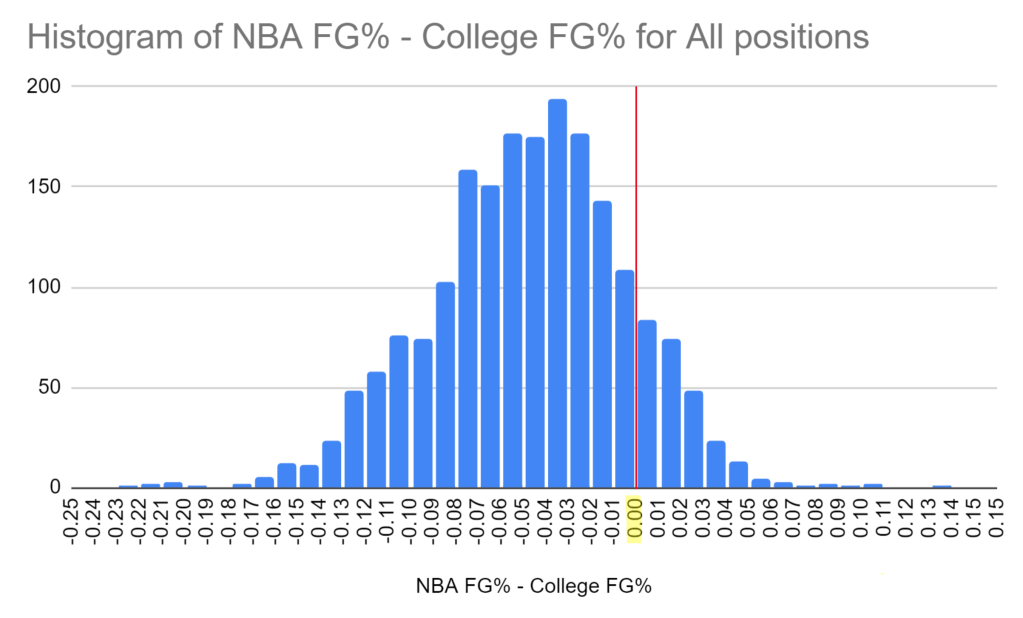
We get a normal distribution that is centered well below the red line, as the average player experiences a FG% decrease of 4.8% when entering the NBA.
4.2 Analyzing By Position
Like we did in the previous parts, we can analyze how these relationships change when we separate by position. Overall, there were 423 point guards, 430 shooting guards, 394 small forwards, 399 power forwards, and 314 centers who met the field goal attempt cutoffs.
4.2.1 Point Guards

We get a similar graph as the one for all players, with the main difference being that almost all of the 60+% shooting players are gone. Plotting on a histogram gives the following:
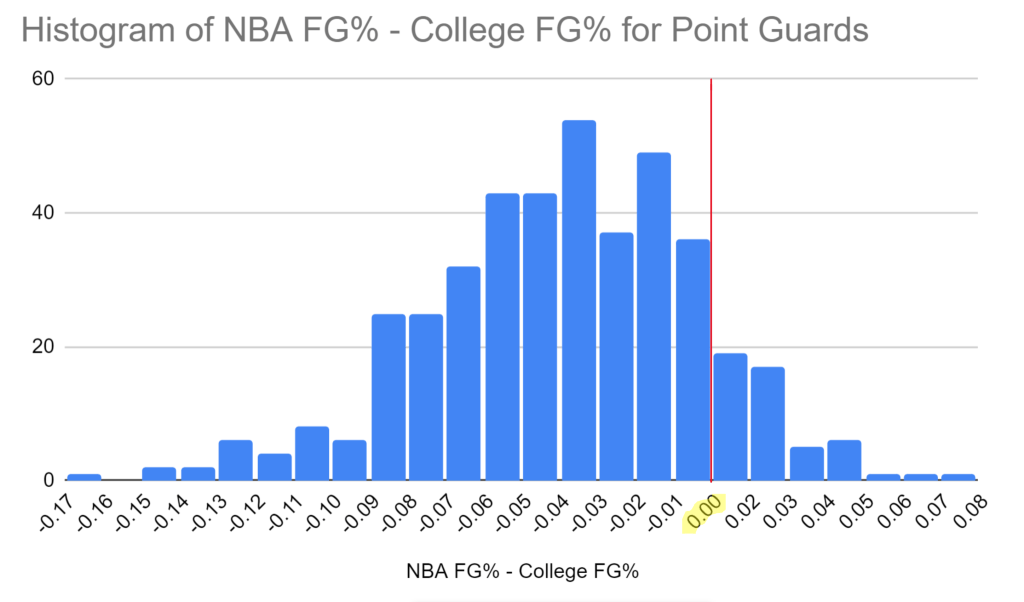
Just as we saw with all positions, the center of the graph is well to the left of the red line. Point guards shoot an average of 42.5% from the field in the NBA, which is a 3.5% decrease from their college average of 46.0%. 16.5% of point guards actually improve their averages, which despite being low is still higher than the overall average. Additionally, this value is about half of what we saw with three pointers and almost one-fifth of the value for free throws, showing just how difficult NBA defenses are to face.
4.2.2 Shooting Guards
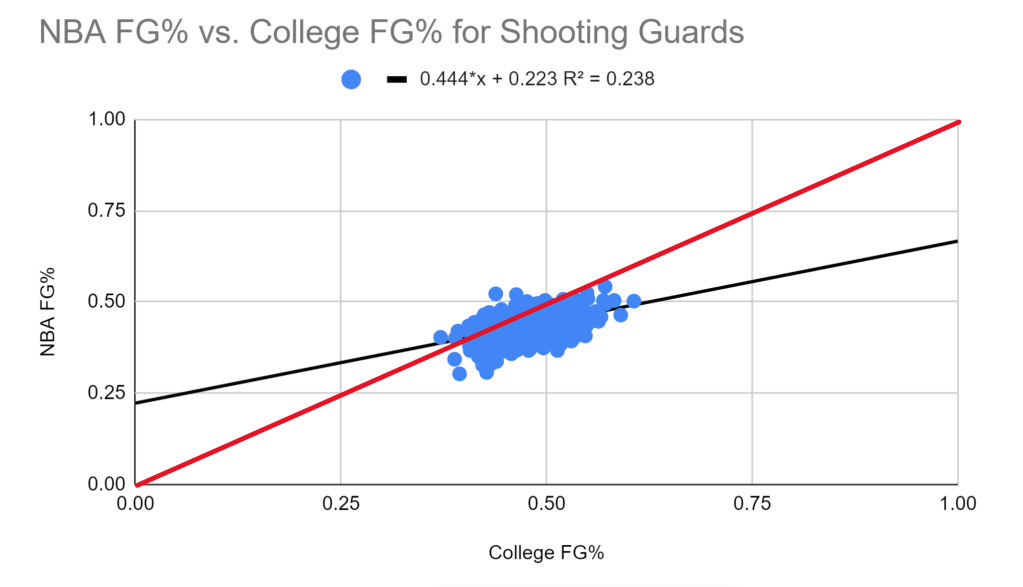
The shooting guard scatter plot has a similar shape to that for the point guards. Again, a vast majority of players reside below the red line. Like with the other plots, the few players above the red line tend to be those whose percentages were worse to begin with and had more room to improve as a result.
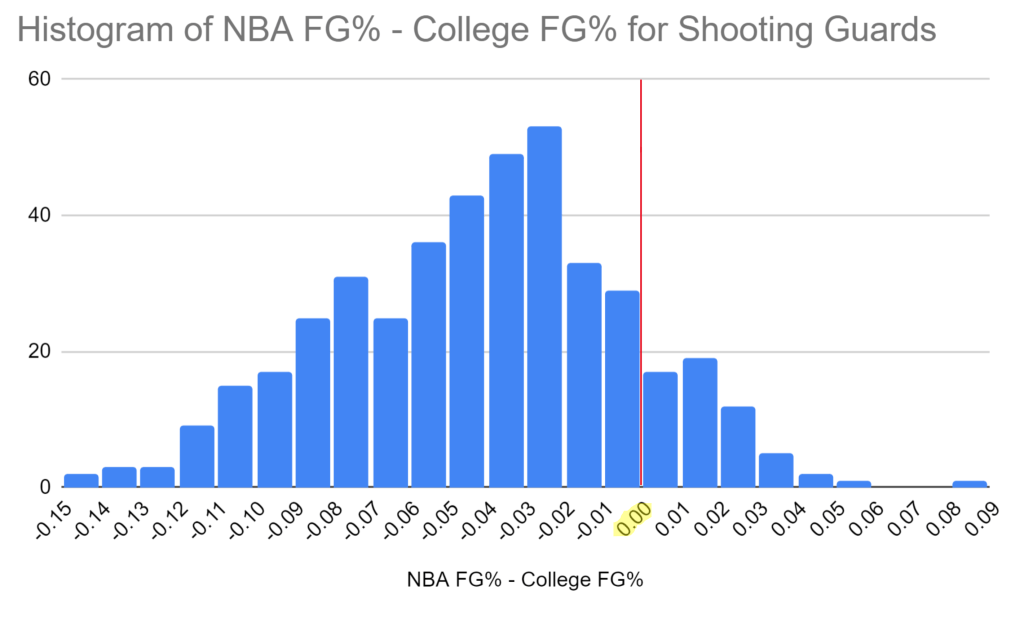
We get a distribution similar to that for point guards. Shooting guards average 43.4% shooting in the NBA, which is a decrease of 4.2% from their college average of 47.8%. Also, only 12.5% of shooting guards improve their field goal percentage when entering the NBA. Overall, the dropoff is larger than that of point guards, but shooting guards also shoot better than point guards.
4.2.3 Small Forwards
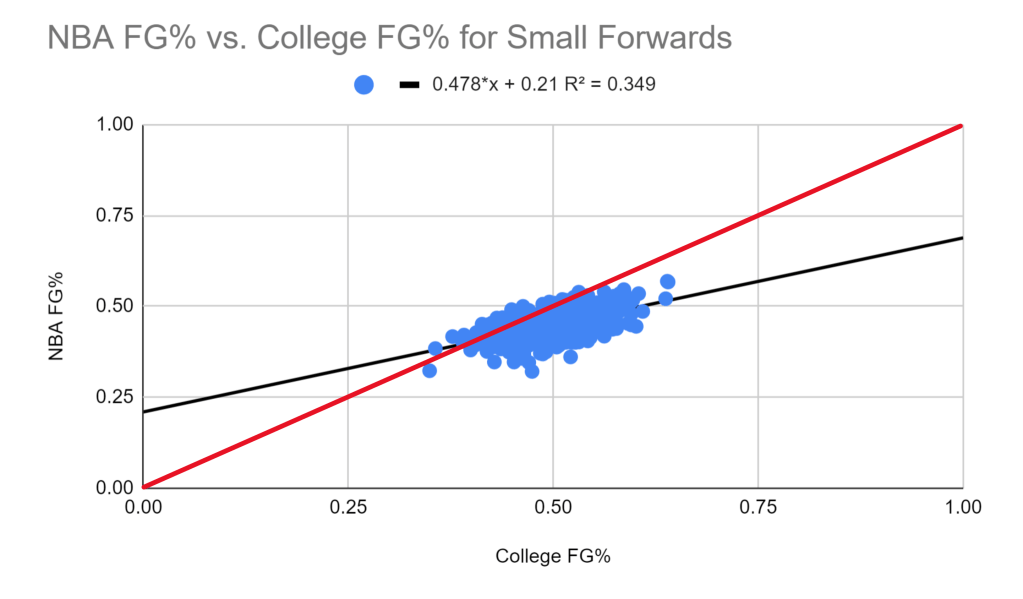
We once again get a similar distribution, although this time there is a wider range of field goal percentages than there was for guards.
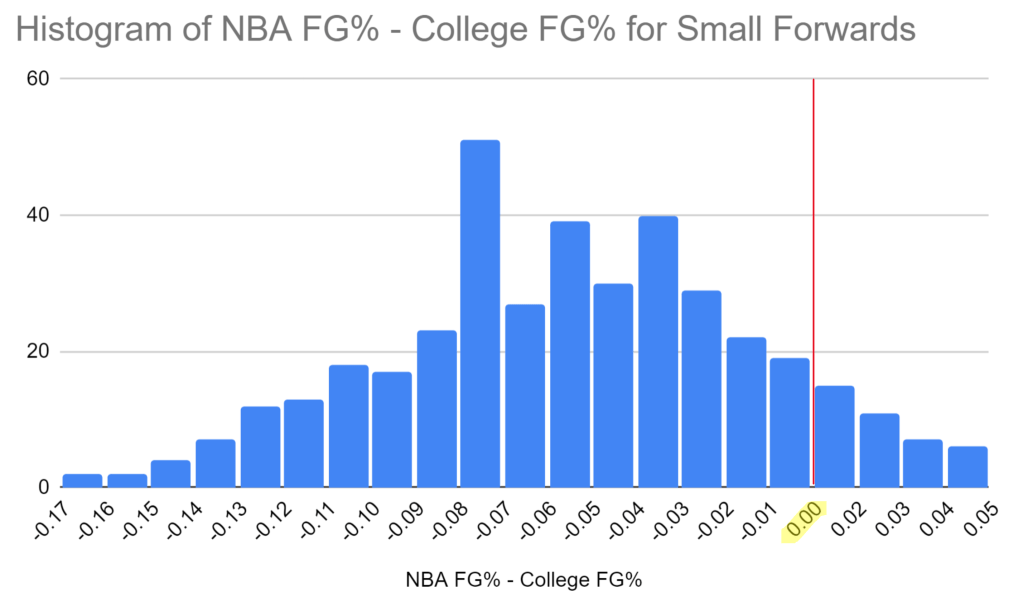
The histogram has a different shape than those we’ve seen so far. The graph doesn’t fall off as quickly, meaning there’s more players at each extreme of improving/regressing. Despite this increased variability, only 10.9% of small forwards actually improve their FG% from college, which is a smaller figure than those for the guards. The average dropoff is also larger than that of the guards, with the average NBA FG% of 44.8% being 5.0% lower than the average college FG% of 49.8%. This has a similar property from the shooting guards numbers. That said, despite the largest dropoff so far, small forwards do shoot better than guards.
4.2.4 Power Forwards
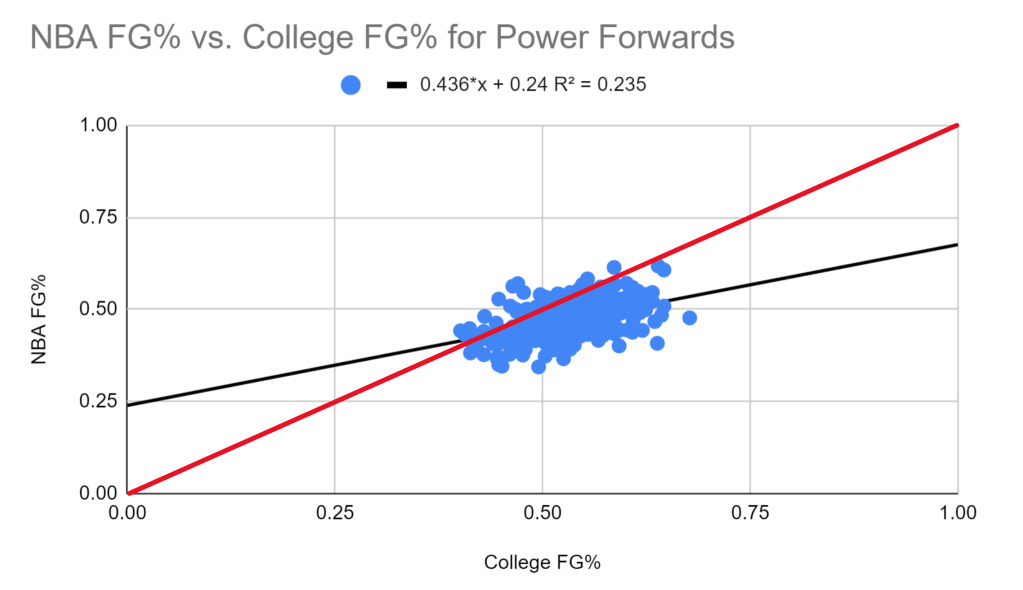
The scatter plot for power forwards is clearly centered further to the right when compared to the previous graphs. This indicates that power forwards are more efficient shooters, and this is expected since their shots are usually closer to the rim.
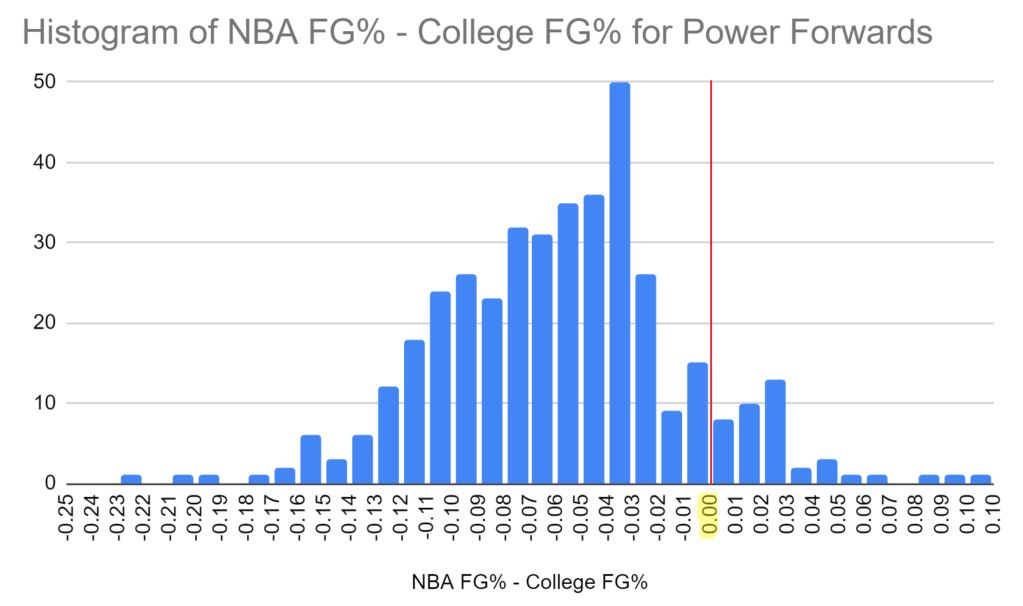
We get a similar distribution, although this time it more heavily leans left, and as a result only 10.0% of power forwards actually show improvements in FG%. Continuing the trend, power forwards have the biggest dropoff but are also the best shooters so far, with their average NBA FG% of 47.0% being a 5.9% decrease from their college average of 52.9%.
4.2.5 Centers
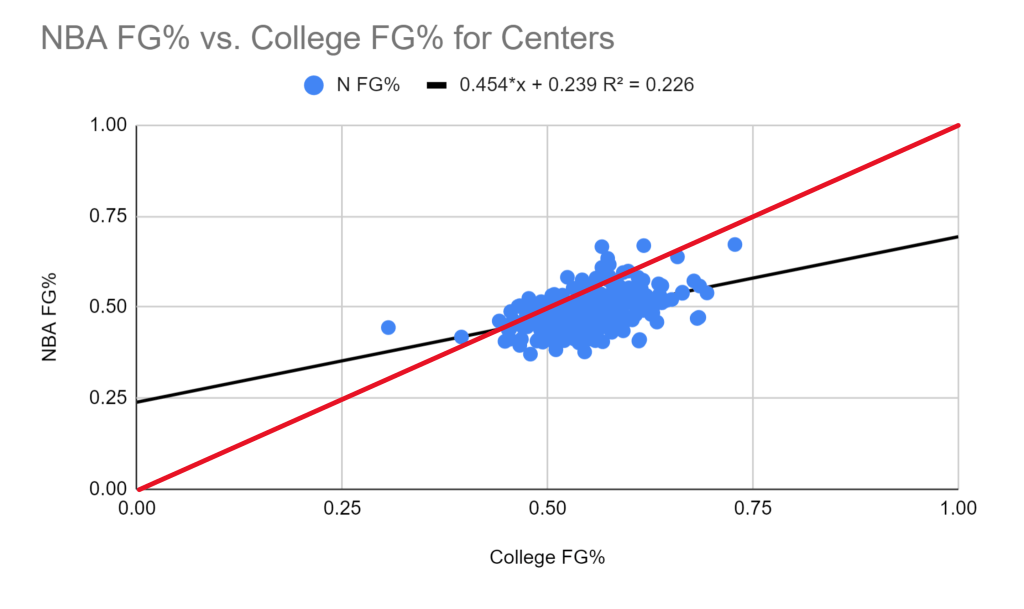
The scatter plot for centers is pretty similar to that for power forwards, but shifted even more to the right.
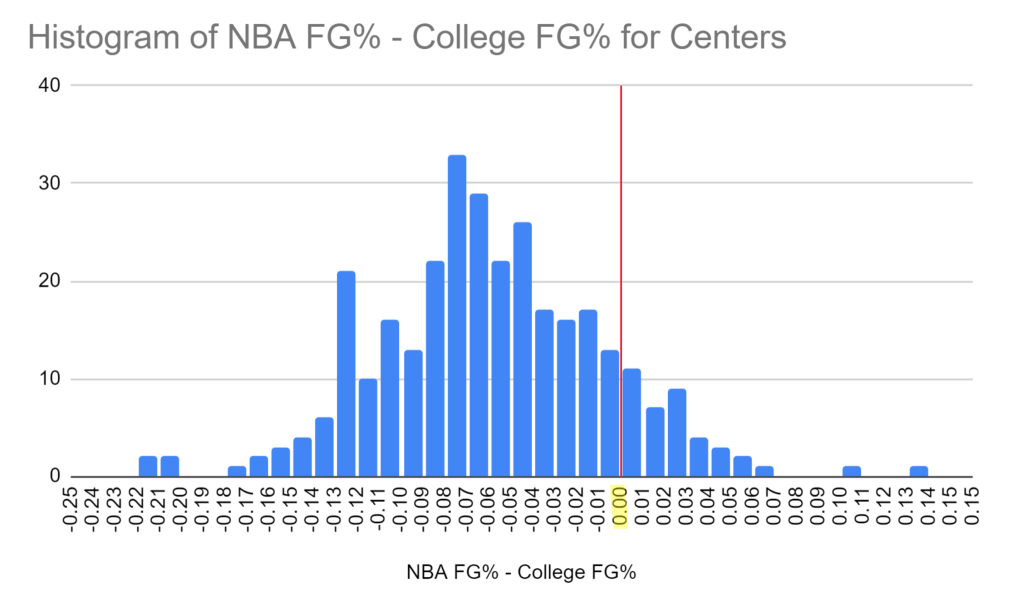
The distribution is similar to those of other positions, and 12.1% of centers improve their FG%, which is close to the overall average. The trend of bigger dropoff but better shooting is completed, as centers shoot an average of 48.8% in the NBA, which is a 6.0% decrease from their average of 54.8% in college.
5. Conclusion
We started with free throws, where the results were predictable: players tended to slightly improve. The main takeaway there was that there wasn’t a significant difference based on position, meaning big guys that struggled in college usually didn’t make up any ground in the NBA.
We then moved to 3P% and FG%, and the results were similar for the two. On average, players had significant drops in efficiency once entering the NBA. That said, there was much more variability on a player-to-player basis, and the overall correlation was pretty weak. There were also noticeable differences in terms of positions. When it came to 3-point shooting, smaller players shot better than bigger players but had larger average dropoffs in efficiency and were less likely to improve. The opposite occurred with overall field goal shooting, as bigger players shot better than smaller players but had larger average dropoffs in efficiency and were less likely to improve.
Overall, the trends are pretty consistent when it comes to the population of NBA players as a whole, but there is enough variability on a player-to-player basis to show that if you truly want to project how efficient a college player will be in the NBA, the box score might not be enough.
