Part 1 of this series analyzed how free throw shooting translates from college to the NBA. We’ll now look at how three point shooting translates between the two leagues.
3. Relationship Between College 3P% and NBA 3P%
Unlike the free throw, the 3 point shot in the NBA is actually very different from that in college basketball, since the 3-point arc is several feet further back. The college 3-point line is a constant 20 feet and 9 inches away from the basket, and the NBA 3-point line varies from 23 feet and 9 inches at the top of the key to 22 feet at the corners.
We’ll consider the 799 players who shot at least 30 three-pointers in college and at least 100 three-pointers in their NBA career.
3.1 NBA 3P% vs College 3P%
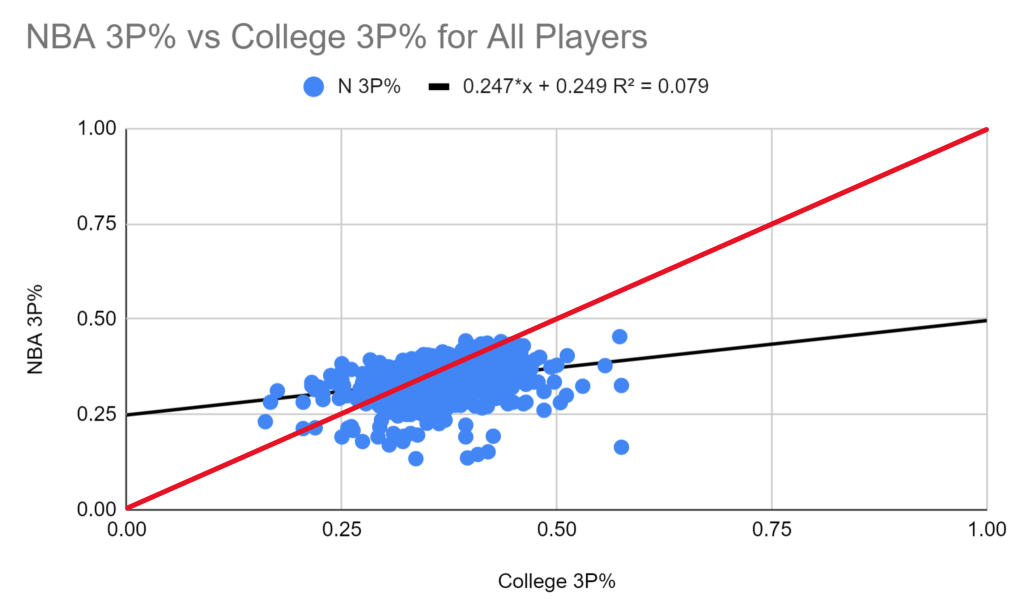
Unlike with free throws, the majority of players fall below the red line, meaning that most players experience a drop in 3P% after entering the NBA. This is likely due to the increased distance of the 3P line. That said, there are still a significant amount of players who are above the red line, but most of these players had a relatively low college 3P%, giving them more room for improvement. Also, the R2 value of 0.079 is much lower than that of FT%, meaning it’s pretty hard to predict a player’s NBA 3P% just given how well they shot on 3’s in college.
To better visualize the distribution of how players are getting better/worse, we can look at a histogram of the difference between a player’s NBA 3P% and their College 3P%:
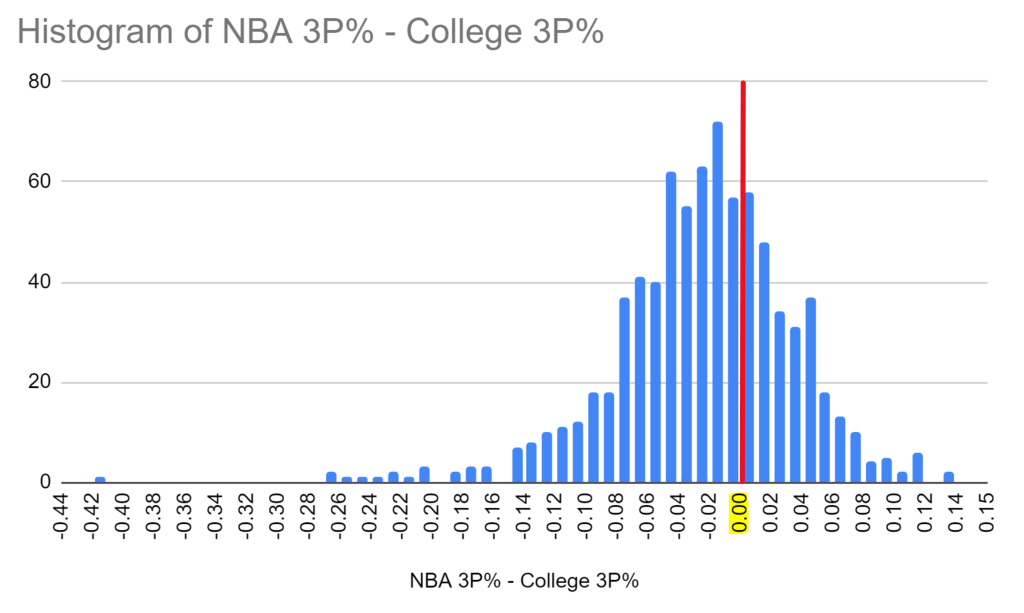
The histogram has a normal distribution and is centered to the left of the red line. It turns out that 32.5% of all eligible players improved their 3P%, while 67.5% had a worse 3P% in the NBA or maintained the same percentage. Additionally, players shoot an average of 33.9% in the NBA, which is an 2.5% decrease from their college percentage. Overall, players get slightly worse, but there’s still a lot of variability.
3.2 Analyzing By Position
Just as we did with free throws in part 1, we can again analyze further by looking at each position separately. We define position to be what the player was listed as in his first season in the NBA. Overall, 269 point guards, 247 shooting guards, 177 small forwards, 91 power forwards, and 16 centers fit the 3P shooting criteria.
3.2.1 Point Guards
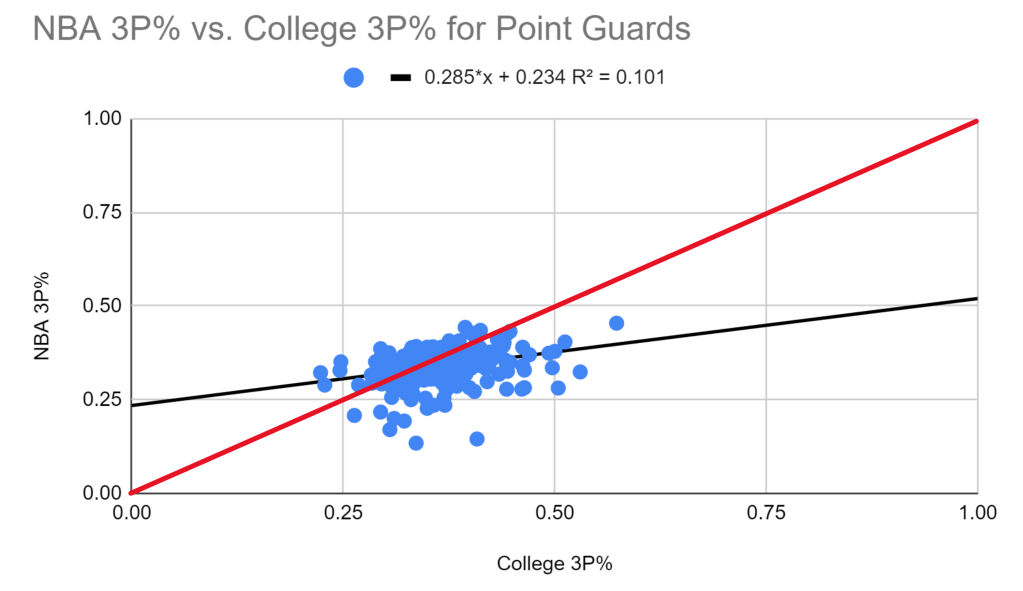
The shooting percentages for point guards are similar to the overall distribution, with most players falling below the red line. The histogram further illustrates these findings:
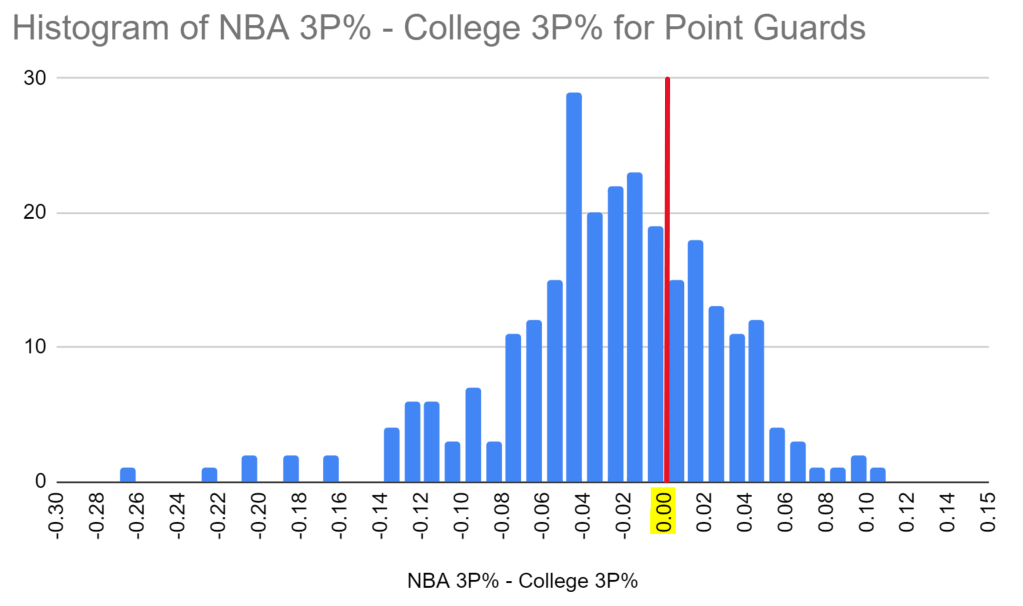
Again we see that the histogram is centered to the left of the red line, meaning most players have decreased 3P%. Furthermore, only 29.4% of point guards increase their percentages, which is well below the amount of players that increased for all positions. This could be because they have less room for improvements due to point guards being one of the primary shooters in college. Additionally, point guards shoot an average of 34.0% from three in the NBA, which is 3.0% decrease from their average college shooting percentage of 37.0%.
3.2.2 Shooting Guards
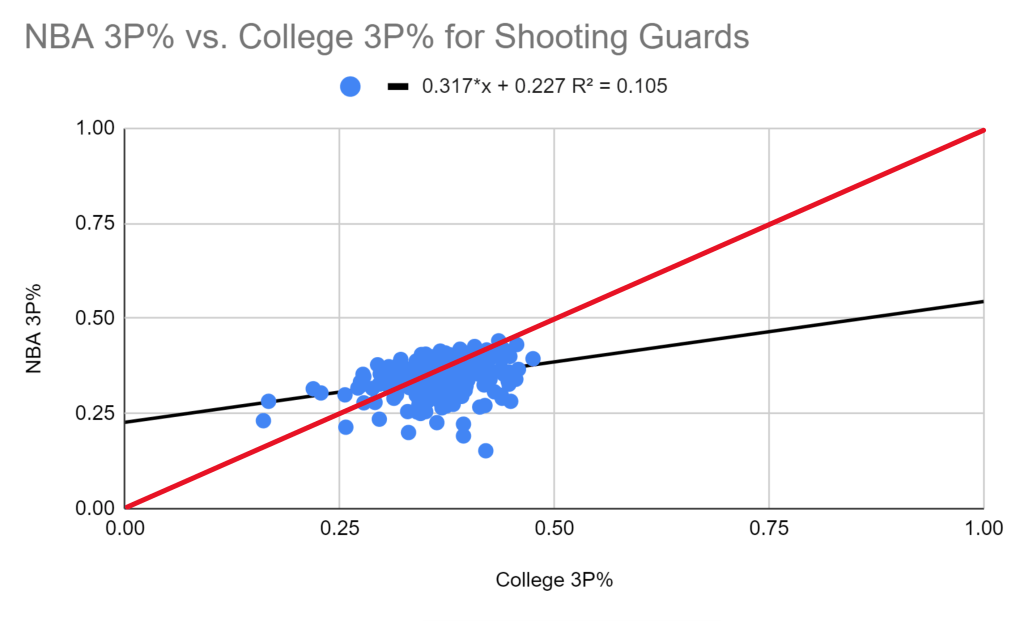
We again see a similar shape with shooting guards, just a little more compact.
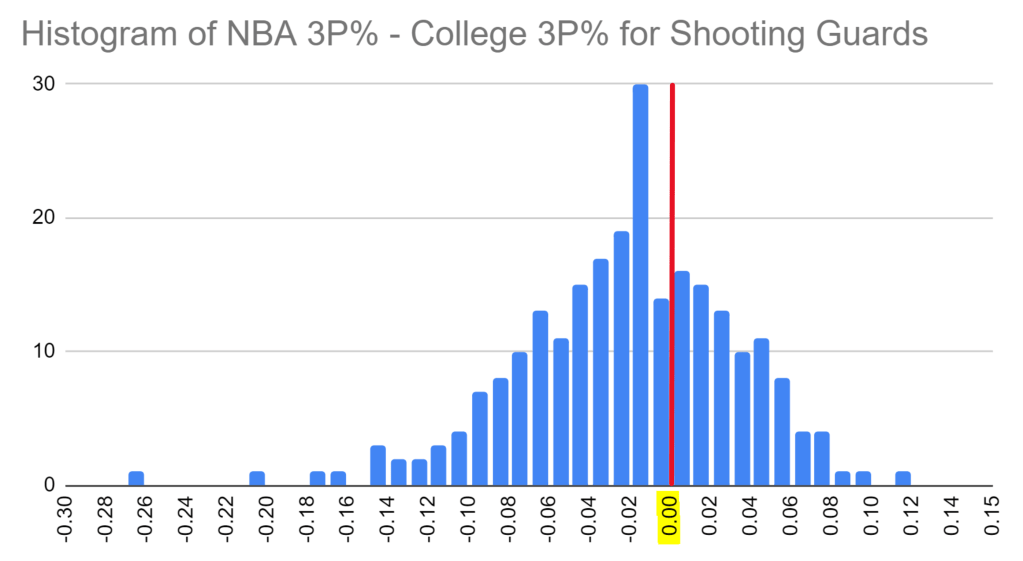
Once again, the histogram is centered to the left of the red line. This time, however, a higher percentage improve their 3P%: 33.3%. Additionally, shooting guards shoot an average of 34.3% from three in the NBA, which is 2.3% decrease from their average college shooting percentage of 36.6%. Overall there’s not much of a difference between the two guard positions.
3.3.3 Small Forwards
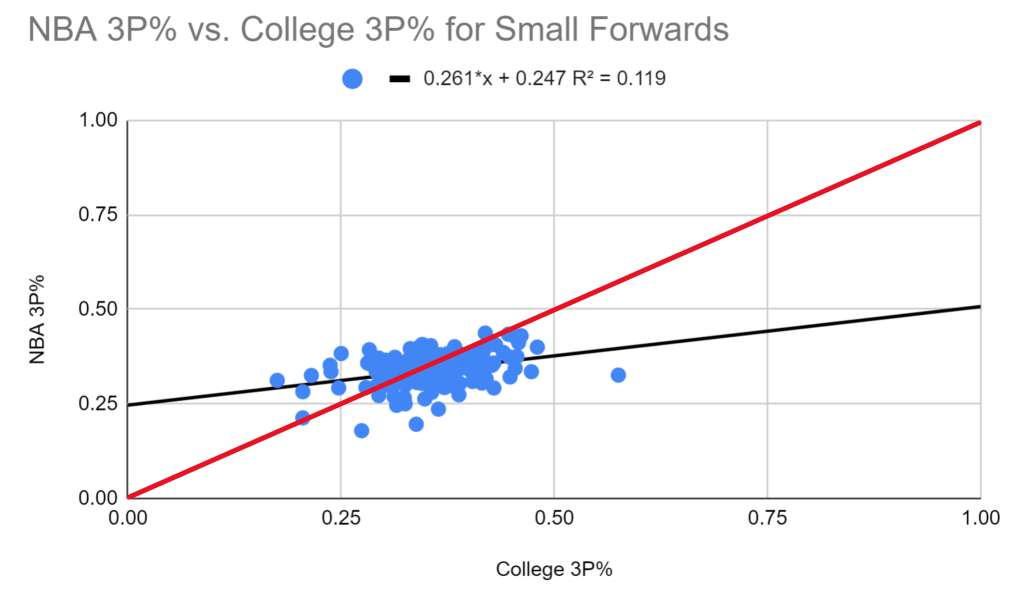
Once again, we get a similar looking graph to the previous two positions. The histogram is also similar.
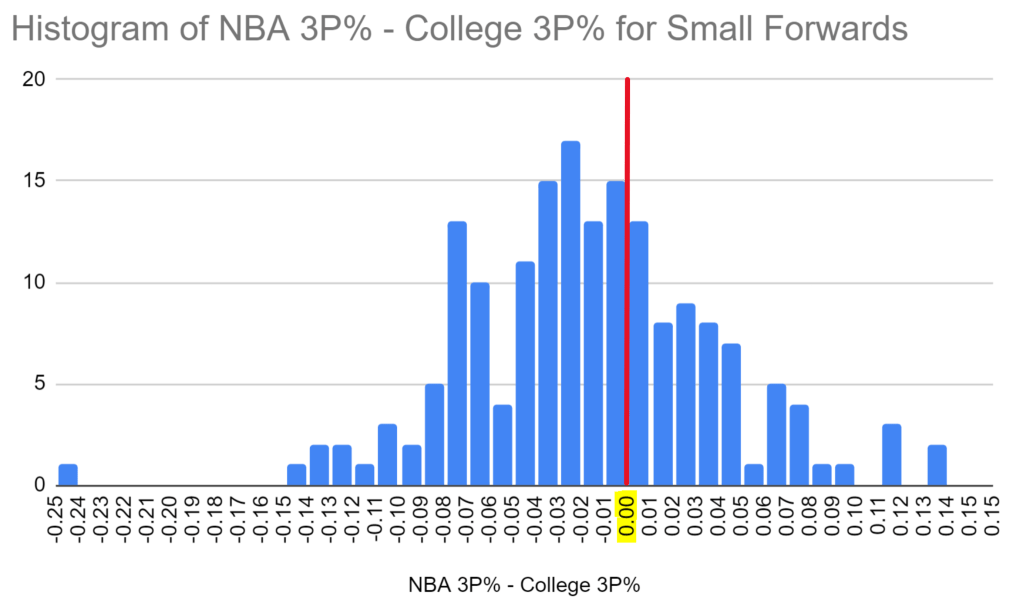
This is centered the closest to the red line, but it is still to the left. Among small forwards, 33.7% saw increases in their 3P% after entering the NBA. Small forwards have an average of 34.0% NBA 3P%, which is a 1.7% decrease from their college average of 35.7%. Compared to guards, small forwards are more likely to improve their shooting, and the average dip in shooting percentage is smaller.
3.3.4 Power Forwards
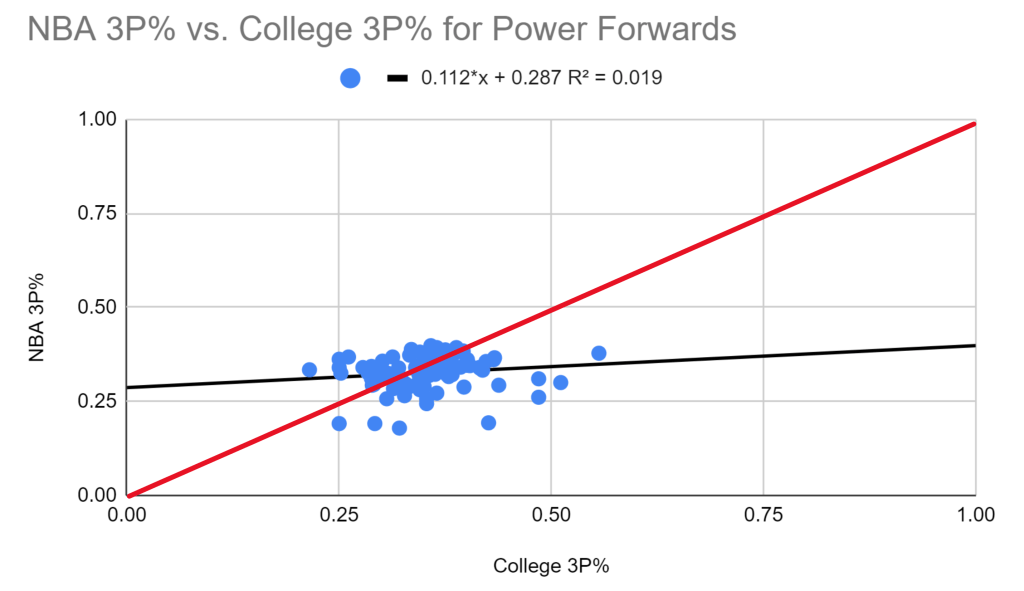
The scatter plot for power forwards yields by far the lowest R2 value, and the graph confirms that the correlation between college and NBA 3-point is very weak. One thing that stands out is that the range of NBA 3P%’s is narrow than that for college, suggesting that many power forwards have a small sample size in college and regress to the mean once they get a larger sample size in the NBA. It’s also worth noting the group of players that met the requirements is much smaller that those for the previous positions.
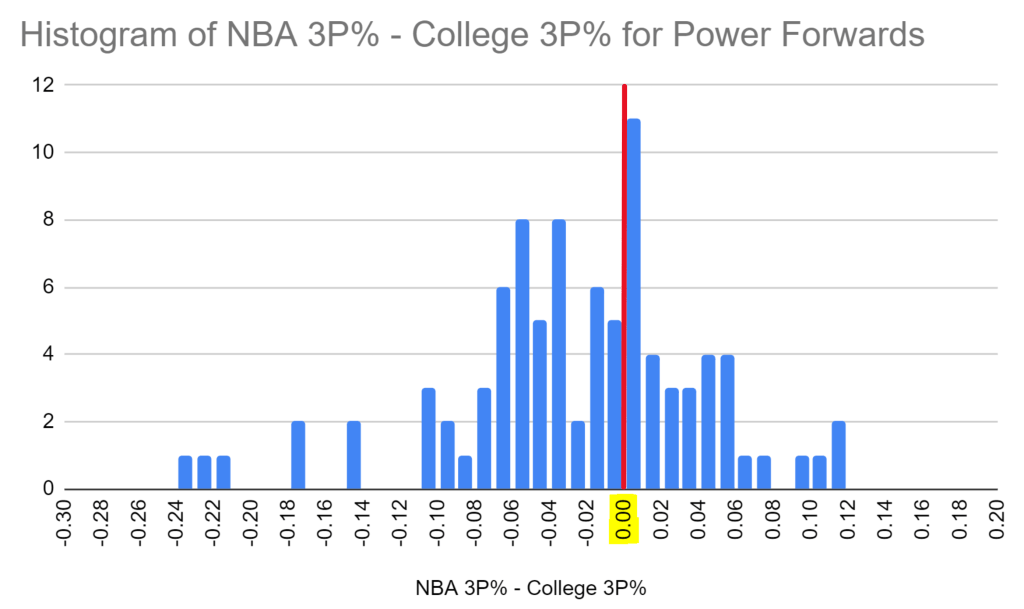
The histogram reveals that 36.3% of power forwards increase their 3P%, which is higher than any of the previous positions. However, power forwards are also worse shooters than any of the previous positions, with their average NBA 3P% of 32.6% being a 2.6% decrease from their average college 3P% of 35.2%.
3.3.5 Centers
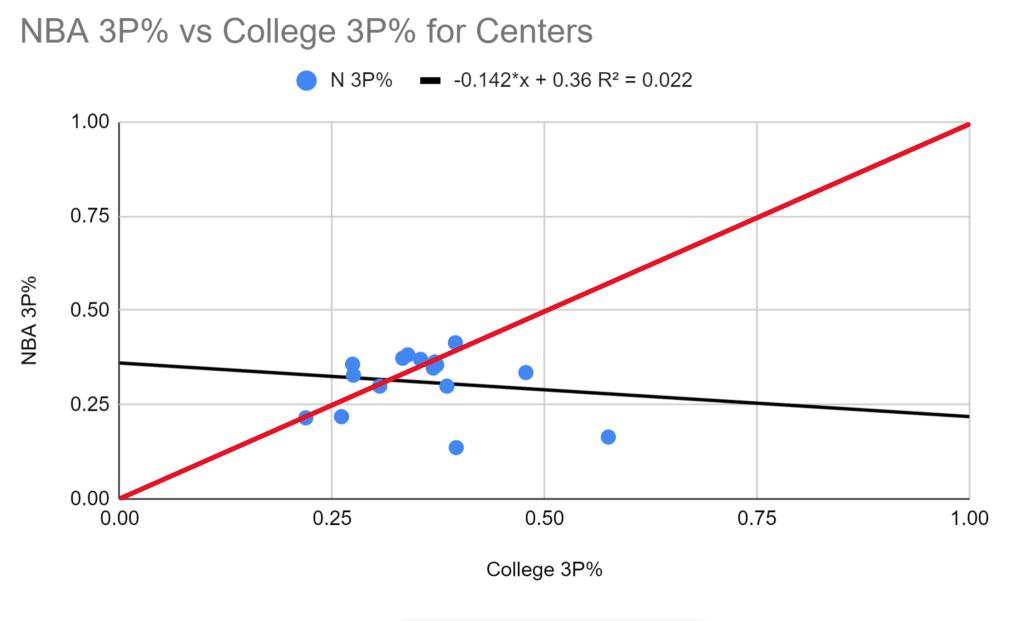
Only 16 centers met the shooting requirements to be considered, and many of them barely made the cut. As a result, it’s difficult to draw any meaningful conclusions.
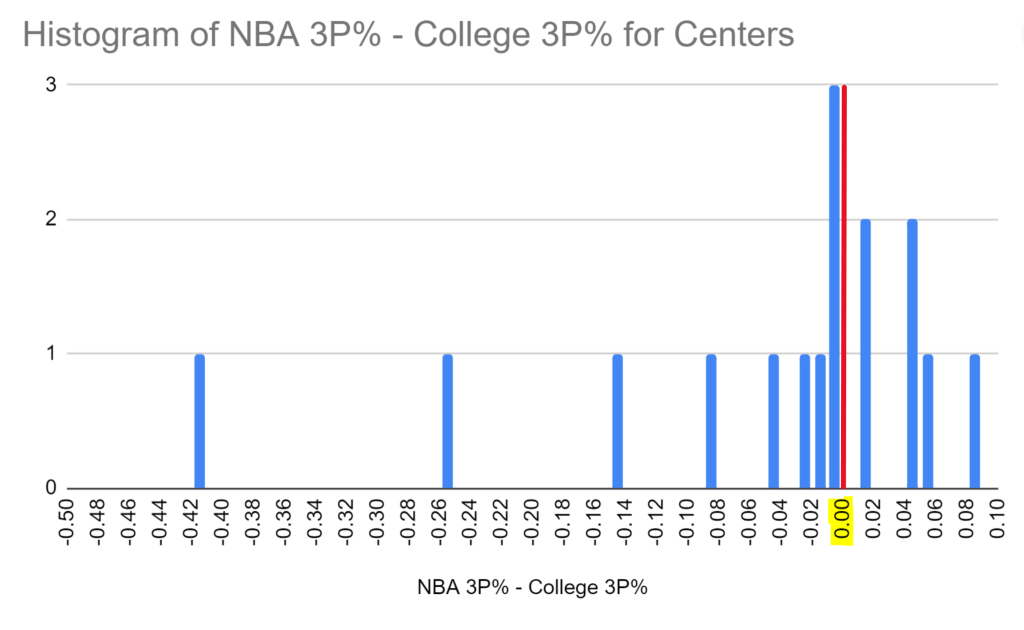
The sample size of 16 eligible centers is too small, but for what it’s worth, 35.3% of centers increased their 3P%, but centers also were the worst shooters and experienced the biggest dropoff, with their average NBA 3P% of 31.0% being a 4.8% decrease from their average college 3P% of 35.8%.
What’s Next?
In this part we’ve seen that players generally have lower three point percentages once they entered the NBA. Guards tend to fall off more than forwards, but they also shoot better than forwards. That said, the main takeaway should be that the overall correlation is pretty low, meaning it’s not enough to just look at a player’s college 3P% when determining how they’ll shoot in the NBA, and scouts should additionally consider factors such as shooting mechanics and work ethic when making their projections.
In the final part of this series, we’ll explore these relationships with field goal percentages.
