A question that many scouts must answer when analyzing a college prospect is “How will this player’s shooting translate to the NBA?”. There are many different factors which affect to what extent a college player will be able to replicate his shooting stats. On one hand, having to face much better defenders in the NBA than college can contribute to weaker shooting from the field. On the other hand, simply getting to continue to practice and working with new coaches should help increase shooting at all levels.
We will try to address this question from an analytical perspective, examining the relationship between NBA and NCAA shooting stats.
1. Preliminaries
We’ll break this down into 3 sections: field goal percentage, three point percentage, and free throw percentage. For each section, we’ll have scatter plots showing the relationship between NBA shooting and college shooting and histograms showing the distribution of changes from college shooting to NBA shooting.
In each of the scatter plots, the red line is the graph of y = x, which represents an equal shooting percentage in the NBA and in college. Being above this line is indicative of improving one’s shooting percentage when entering the NBA, and being below the line means that the player’s shooting percentage decreased.
Furthermore, in each of the histograms, the red line represents a difference of zero when subtracting college free throw percentage from NBA free throw percentage, which essentially means no improvement. Similarly, being to the right of this line means a player improved, and being to the left means a player’s free throw percentage decreased when entering the NBA
2. Relationship Between College FT% and NBA FT%
We start with the simplest shot type: free throws. These are unguarded, and since the free throw line is the same distance in both college and the NCAA, there’s essentially no differences between the shot at the two different levels. For this portion, we will only consider the 1764 players who took at least 30 free throws in college, and at 100 free throws in their NBA
2.1 NBA FT% vs College FT%
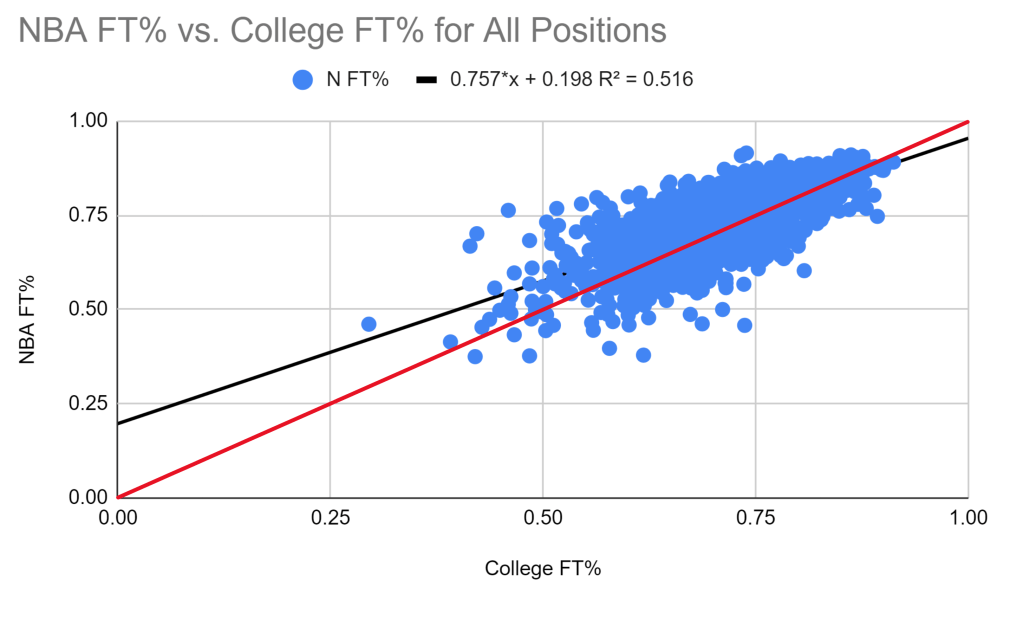
We see that the majority of players fall above the red line, indicating that players generally are able to improve their free throw percentage when entering the NBA. However, plenty of players fall below the red line, meaning they got worse. we also have an R2 value of 0.517, which indicates that while there is a decently strong correlation between college and NBA free throw shooting percentage, there’s still a lot of variation in how much players get better or worse.
To better visualize the distribution of how players are getting better/worse, we can look at a histogram of the difference between a player’s NBA FT% and their College FT%:
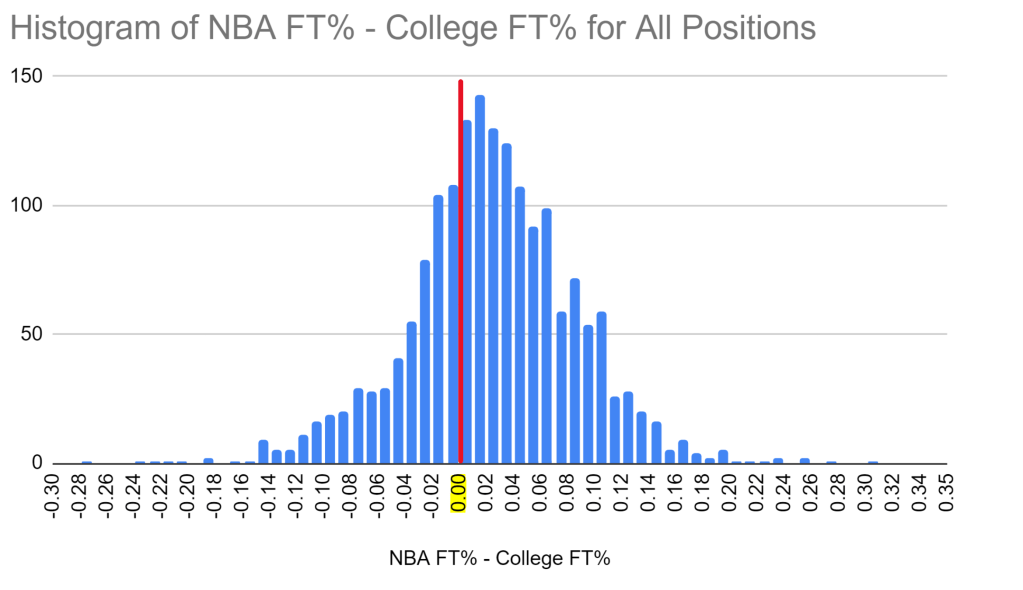
The histogram is centered to the right of the red line, and it turns out that 67% of players improved their their shooting, while 33% either maintained the same stats or decreased. Additionally, we have that on average these players shoot 73.8% on free throws in the NBA, which is an average improvement of 2.3% from college. It’s clear that we can expect a slight increase in free throw shooting percentage when players come to the NBA, and this is expected since they get more time to practice and improve, and the conditions of the shot don’t change.
2.2 Analyzing By Position
Players as a whole tend to be improving their free throw shooting, and we can explore further to see if there’s any differences among different positions. We determined position by what the player was listed as in his first season in the NBA. 367 point guards, 371 shooting guards, 352 small forwards, 369 power forwards, and 304 centers fit the free throw shooting criteria.
2.2.1 Point Guards
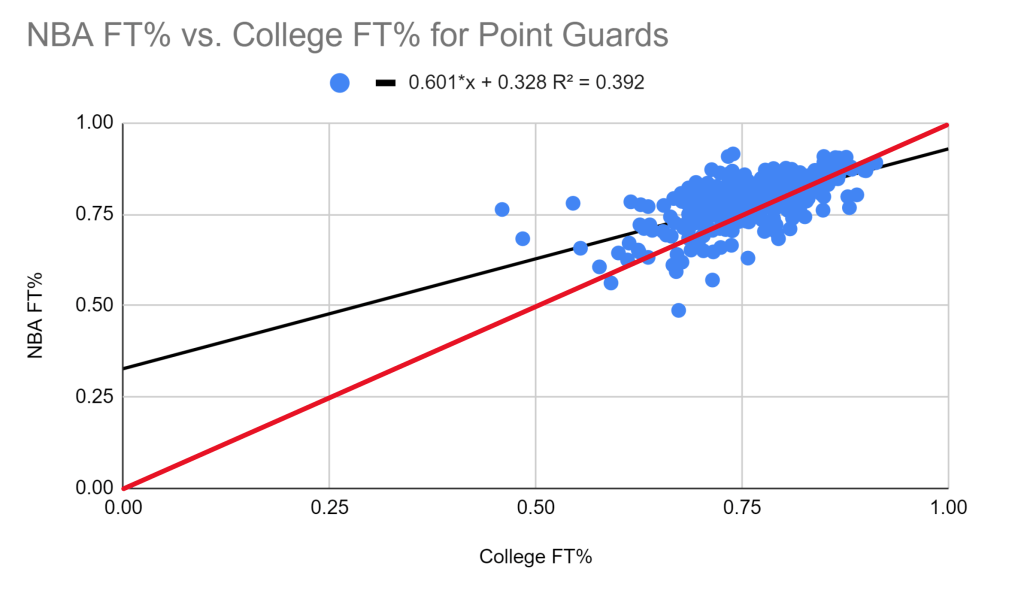
Following the general trend, most point guards improve their free throw shooting, and as a whole they have less variance, being clustered around the (.75, .8) point. This is confirmed by the histogram:
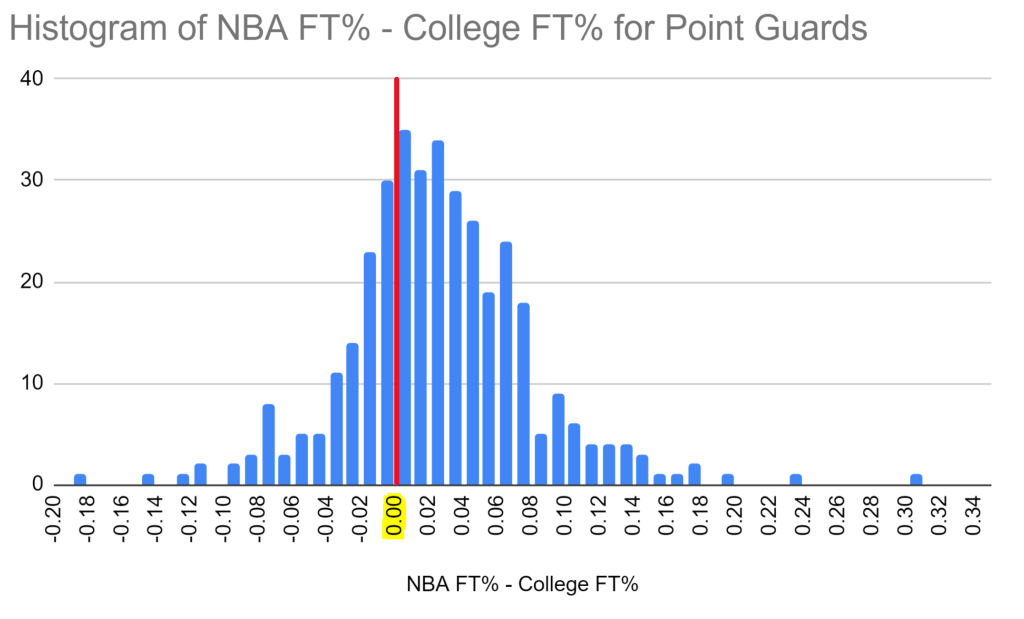
We get a similar shape as the overall graph, with 70% of point guards increasing their FT%, which is slightly higher than the average for all positions. The shooting percentages themselves are much higher, with point guards shooting an average of 78.3% on free throws in the NBA, which is an average improvement of 2.5% from college.
2.2.2 Shooting Guards
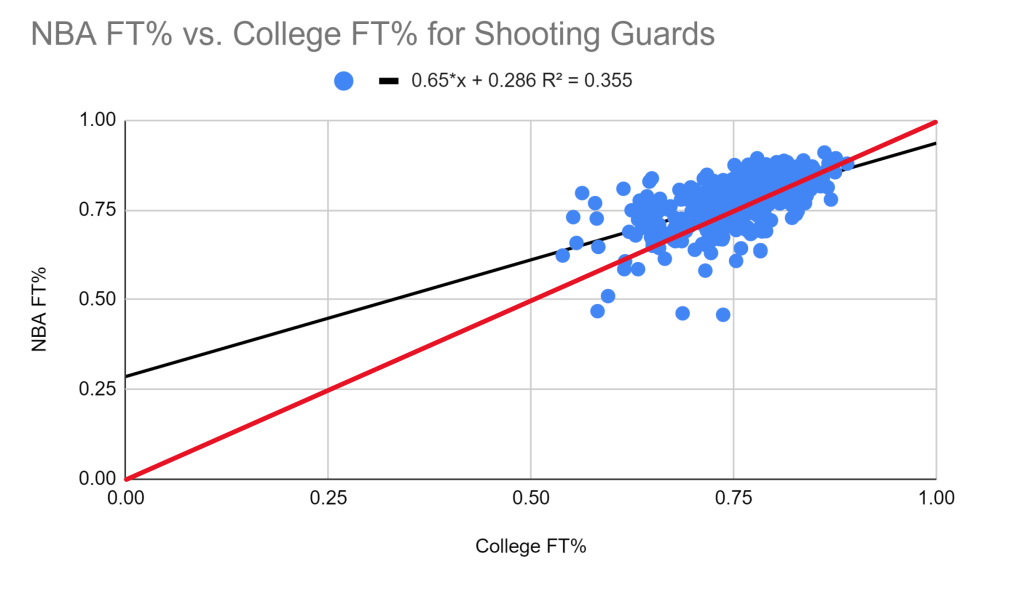
The result is almost identical to that for point guards, and this is expected as not only are the positions somewhat interchangeable, but they’re both expected to be good shooters and scorers. The histogram matches this:
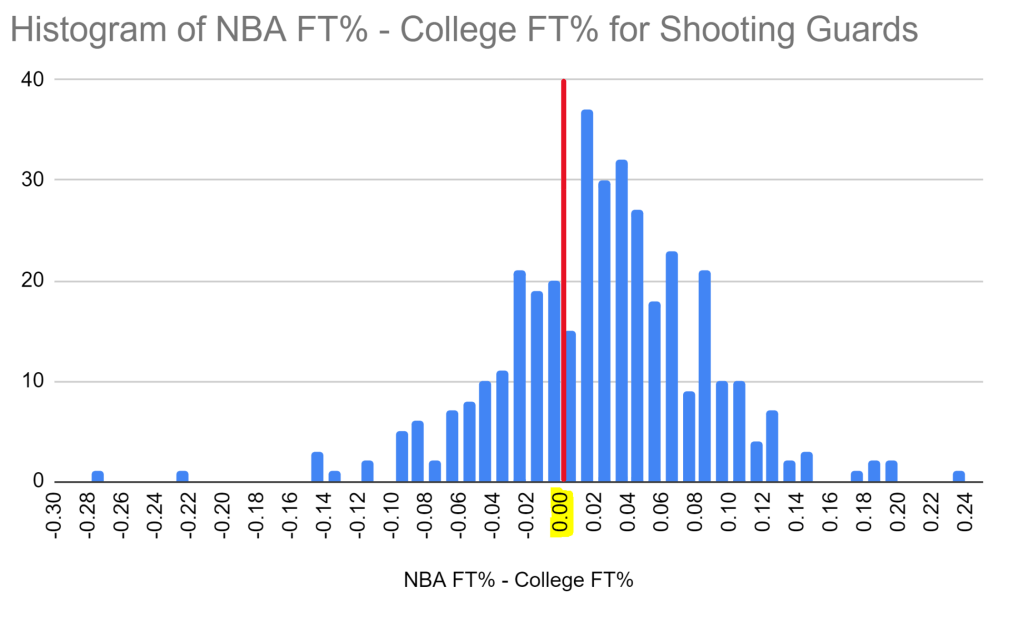
We again get a similar distribution, with 68% of shooting guards increasing their FT%, which is slightly higher than the average for all positions. The shooting percentages themselves are higher than all but the point guards’, with shooting guards shooting an average of 77.4% on free throws in the NBA, which is an average improvement of 2.3% from college.
2.2.3 Small Forwards
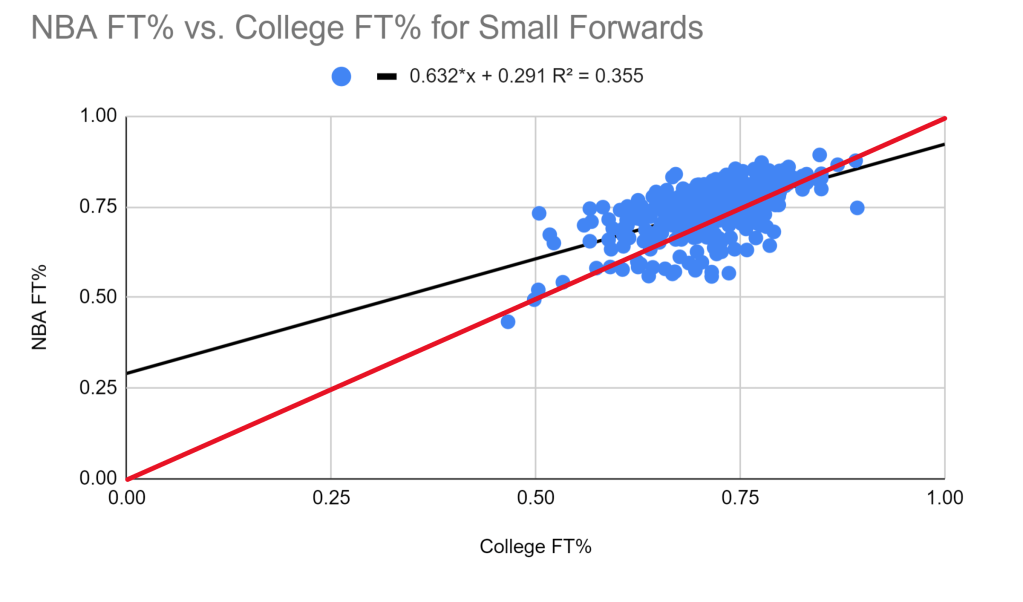
The graph looks similar to those of the guards, with the main difference being that small forwards have lower free throw shooting percentages overall.
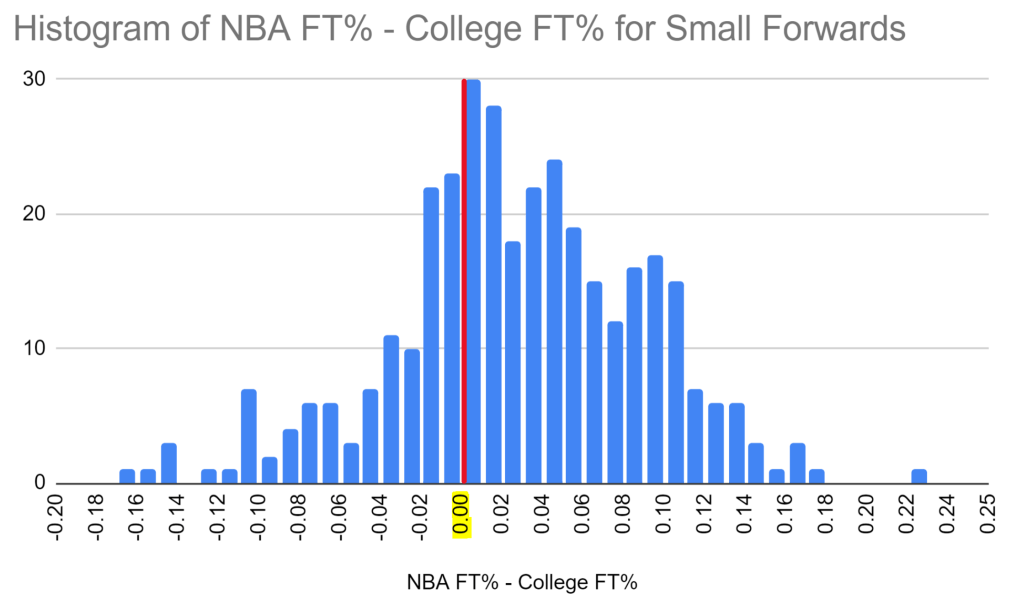
We again get a similar distribution, with 69% of small forwards increasing their FT%, which is slightly higher than the average for all positions. The shooting percentages are noticeably lower than those of the guards, with small forwards shooting an average of 74.3% on free throws in the NBA, which is an average improvement of 2.7% from college.
2.2.4 Power Forwards
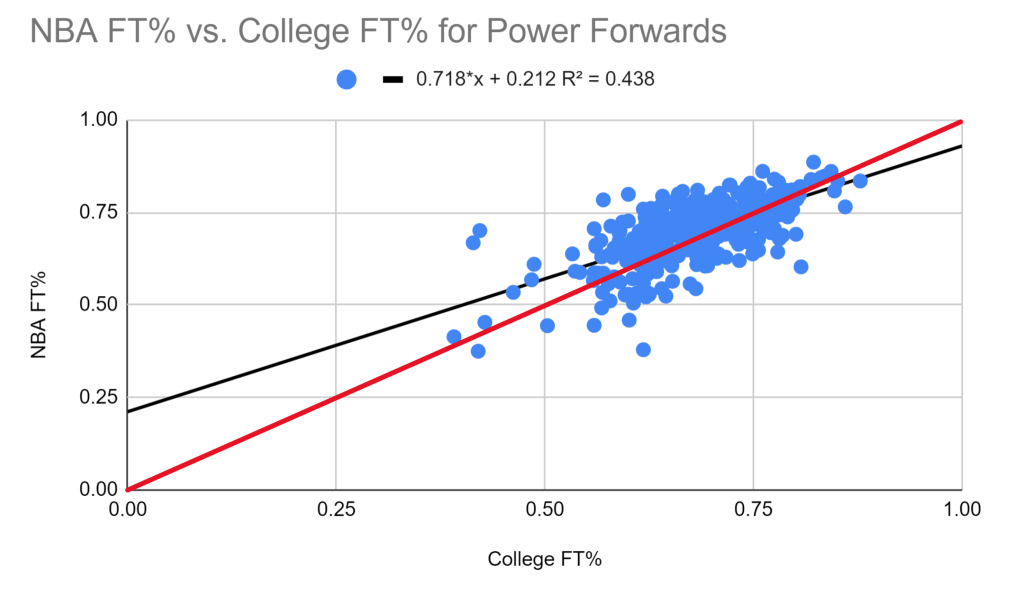
Among power forwards we get the highest percentage of players falling below the red line of any position, and the percentages also continue to fall off. This is illustrated well by the histogram:
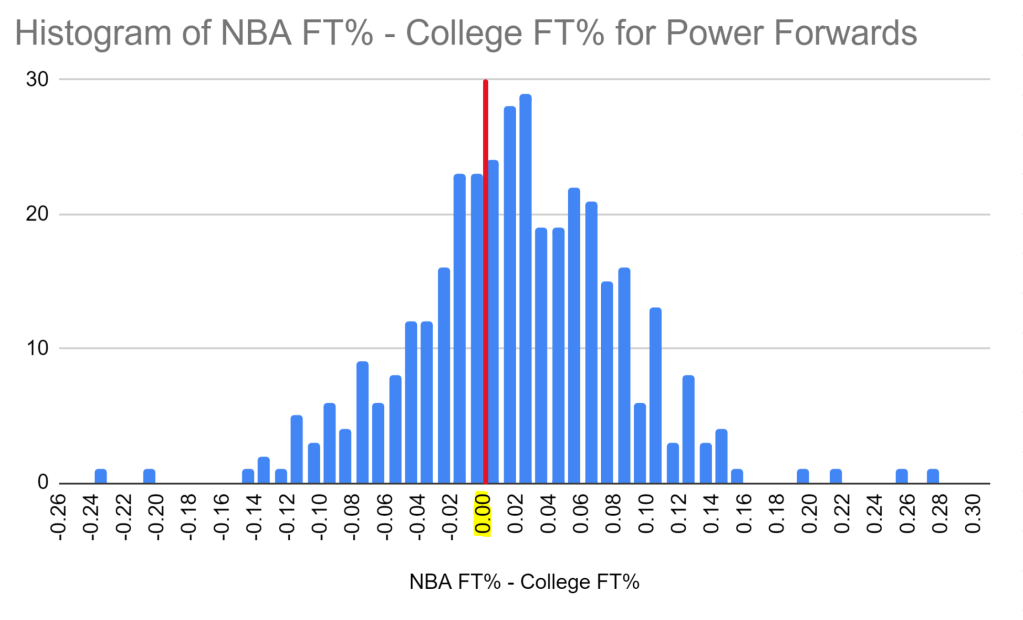
We get a distribution centered closer to 0, with only 63% of small forwards increasing their FT%, the worst for any position. The shooting percentages are also lower than all prior positions, with power forwards shooting an average of 70.2% on free throws in the NBA, which is an average improvement of 1.9% from college (also the worst for any position).
2.2.5 Centers
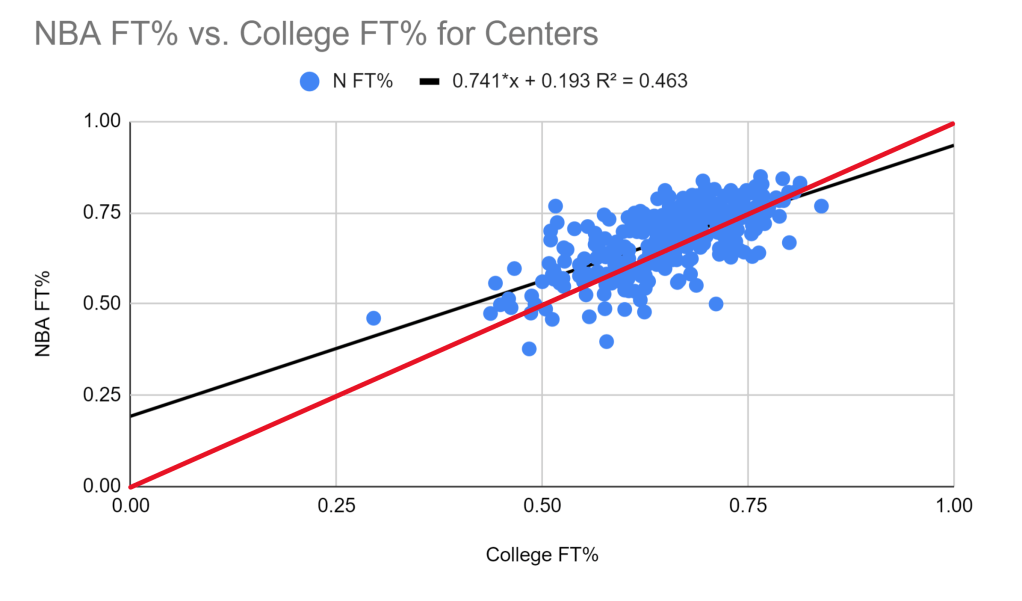
With centers we see not only the worst overall shooting percentages, but also the most variance, as there are both significant numbers in the low 50’s and the high 70’s of free throw shooting percentage. However, as confirmed by the histogram, there still is improvement on average.
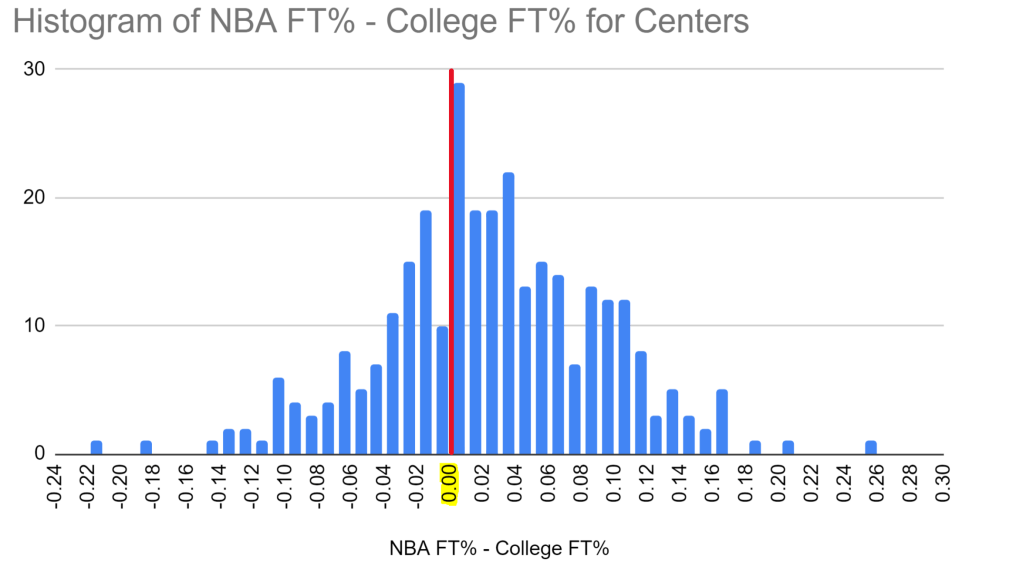
We get a distribution similar to what we’re used to seeing, with 66% of small forwards increasing their FT%, which is slightly lower than the average for all positions. The shooting percentages are the worst of any position, with centers shooting an average of only 67.8% on free throws in the NBA, which is an average improvement of 2.4% from college.
What’s next?
In this first part we’ve seen that players are generally able to make slight improvements to their free throw shooting once entering the NBA. Although there are significant differences in the free throw shooting percentages among different positions, there’s not much of a difference with how much players actually improve. That said, guards do tend to be the best at shooting and improving, with everyone improving on average. This does have significance though: if big guys are struggling with free throws in college, even though they might improve when entering the NBA, they likely won’t pick up any ground compared to other players.
In the next parts we’ll get to the more complicated categories, exploring the relationships with three point percentages and field goal percentages.
