Part 1 and part 2 of this series compared the impact blocks and steals had on a team’s regular season and playoff performance respectively. Part 3 focused on how blocks and steals affect a player’s regular season success. This final part of the series will look at how blocks and steals affect a player’s playoff success.
8. How Blocks and Steals Affect Individual Playoff Success
Similar to part 3, individual success in the playoffs will be defined as playoff win shares per 48. Additionally, we’ll use steals/blocks per 48, so we can avoid having minutes per game be a confounding factor. For example, players who play more minutes tend to get more win shares and more steals/blocks, and this would create a false correlation between steals/blocks and win shares. However, we avoid this issue when we scale everyone’s stats to 48 minutes.
When we look at per 48 stats, we have to filter out players to avoid having anomalies due to players not playing enough minutes. For example, we shouldn’t consider a player who plays 1 minute the whole playoffs and gets 1 block, because they’ll have 48 blocks per 48, which obviously would never be sustainable. To have a playoff run be consider, a player must have played at least 3 games in that season’s playoffs and have averaged at least 10 minutes per game. The reason that the game minimum is 3 and not 4 is because the First Round used to be first to 3 wins, meaning a lot of players only got the opportunity to play 3 games if they got swept. Also, the seasons considered are from 1972-73 to the present, since that is when these stats started getting recorded.
Lastly, its worth noting that because the playoffs are relatively short for many players, there are plenty of cases where a player will not get a single steal or block and have 0 steals/blocks per 48. There’s also a few cases where players will happen to have 0 win shares in the playoffs, and this can often occur if their team doesn’t win a playoff game that season.
8.1 Win Shares Per 48 vs Blocks Per 48
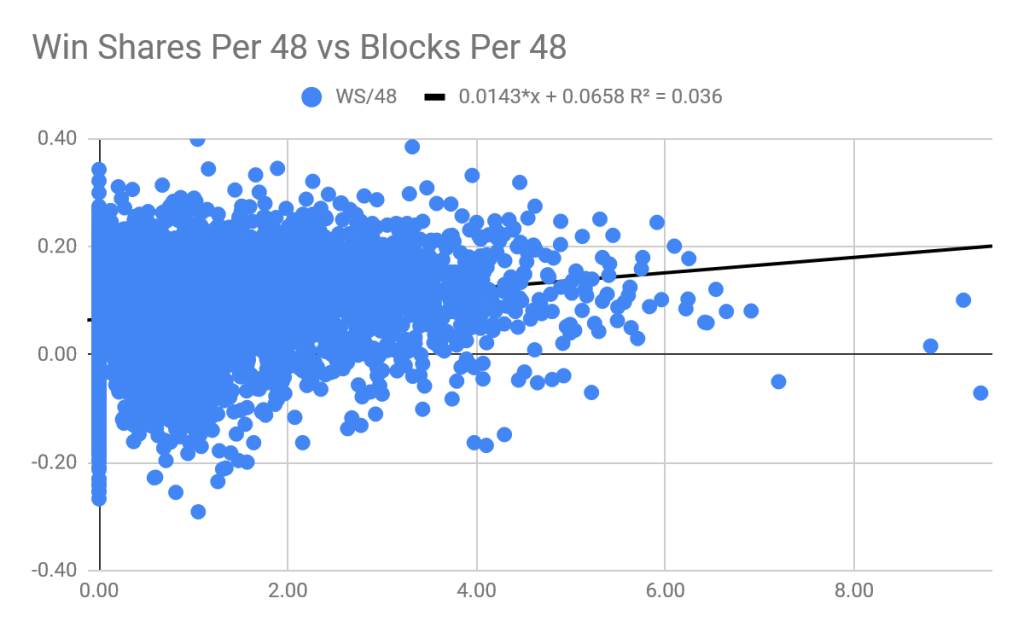
The R2 value of .036 and slope of 0.0143 indicates a positive but not so significant correlation. In the part 3, when we looked at the regular season, the graph had an R2 value of .039 and slope of 0.0108. This suggests that blocks might be slightly more valuable in the playoffs, but there’s not much of a difference. Also, there is varying success throughout all levels of blocks per 48, but once a player averages 4+ blocks per 48, they almost always have positive win shares.
8.2 Win Shares Per 48 vs Steals Per 48
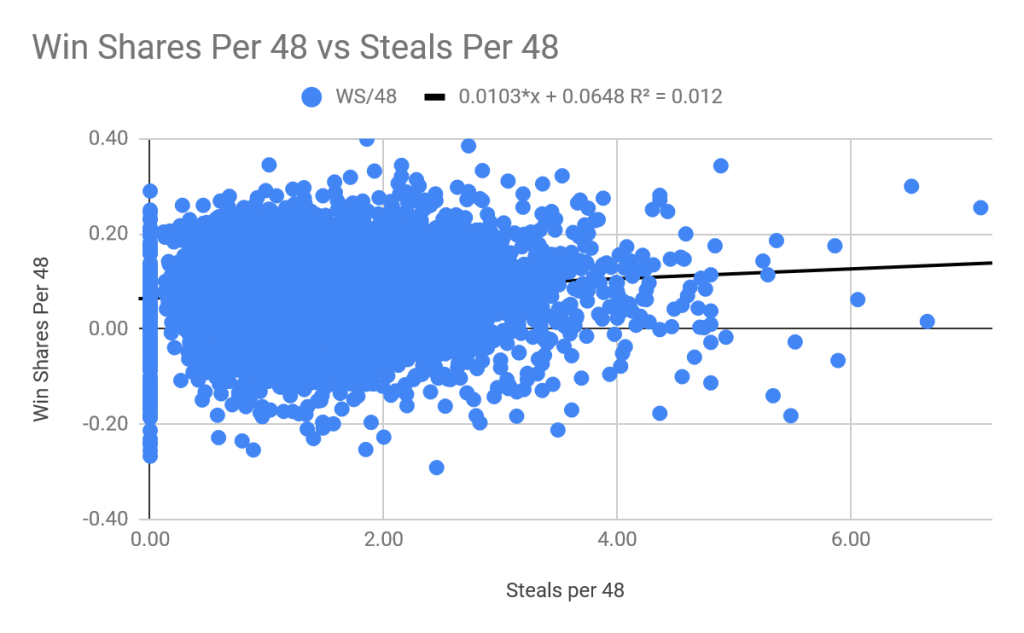
When looking at steals, the R2 value drops from 0.036 to 0.012, and the slope also decreases. This suggests that the relationship is weaker for steals and that steals have less value. Interestingly, this same graph had an R2 value of .003 and an almost-zero slope in part 3, when we looked at regular season win shares, suggesting that the value of steals increases in the playoffs. Still, they’re well behind blocks.
9. How Blocks and Steals Affect Individual Offensive Playoff Success
Like part 3, we can now again look at the two components of a player’s win shares: offensive win shares and defensive win shares. A player’s win shares are the sum of their offensive and defensive win shares. These two stats will be adjusted to per 48 minutes. Also, we expect to have more players with 0 offensive/defensive win shares now that we’re breaking down win shares even further.
9.1 Offensive Win Shares Per 48 vs Blocks Per 48
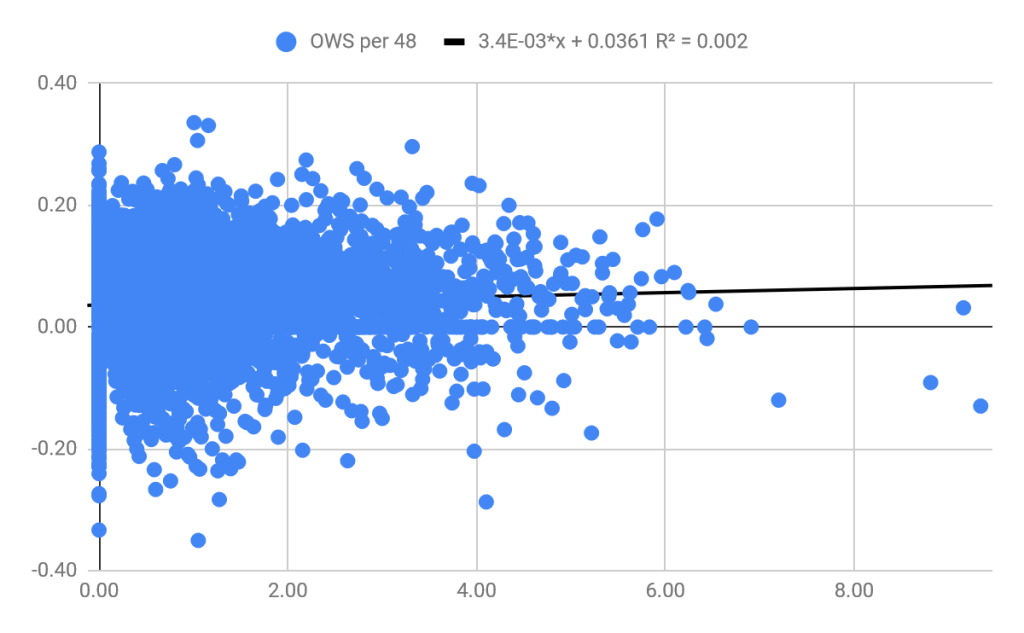
We see that blocks have essentially no relationship with offensive success, and this is the same thing we saw in part 3 when we looked at the regular season.
9.2 Offensive Win Shares Per 48 vs Steals Per 48
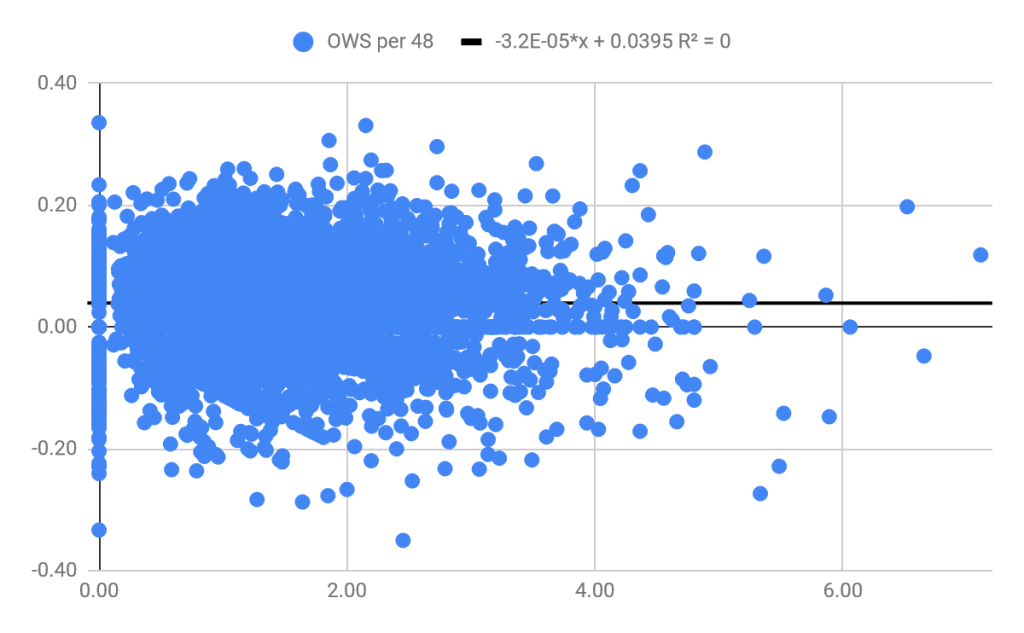
Again, there is essentially no relationship between steals and offensive success, and the R2 value even rounds down to 0. We saw the same thing in the regular season.
10. How Blocks and Steals Affect Individual Playoff Defensive Success
Unlike the offensive win shares, defensive win shares are expected to actually have a relationship with steals/blocks.
10.1 Defensive Win Shares Per 48 vs Blocks Per 48
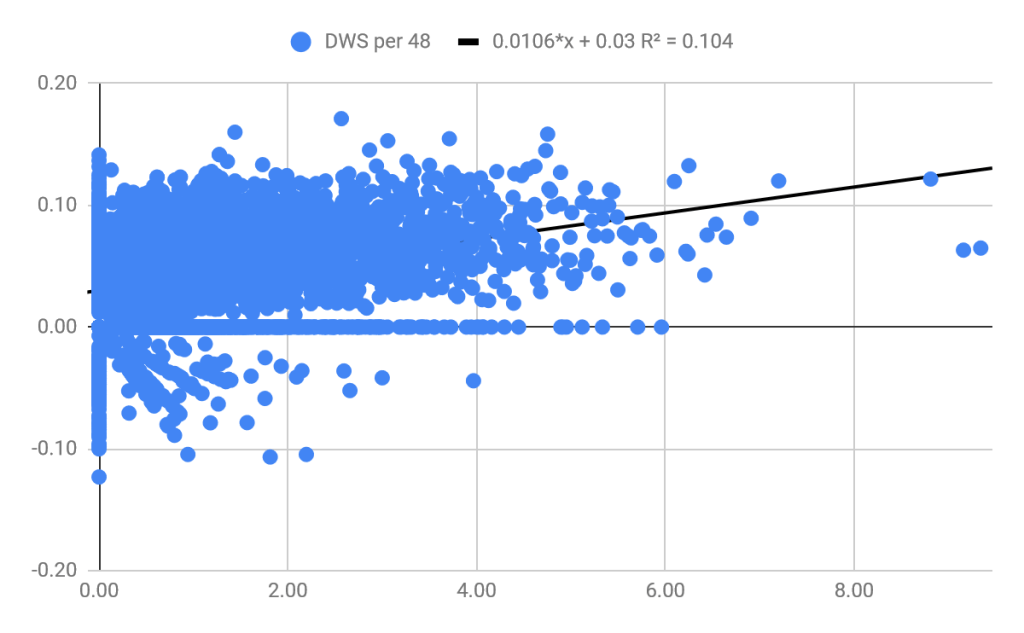
We get a relatively high R2 value if 0.104. In part 3, we had an R2 value of 0.194, but in both cases there is a slope of 0.106, so there doesn’t seem to be any real change in value. An interesting trend is that there were a lot of players who averaged 4+ blocks per 48, and not a single one of them had negative defensive win shares.
10.2 Defensive Win Shares Per 48 vs Steals Per 48
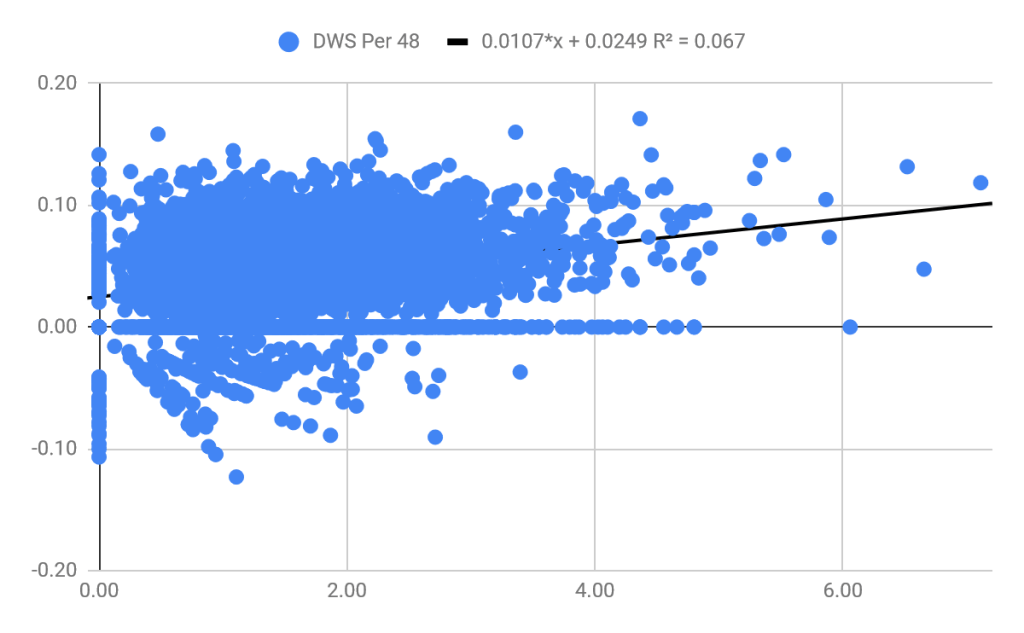
When looking at steals, the R2 value drops to .067, significantly below that of blocks. However, the slope is 0.0107, almost identical to the blocks’ slope of 0.0106, suggesting that there might not be any real difference in value. Also, just like with blocks, every player who averaged at least 4 steals per 48 had positive defensive win shares. Interestingly, the regular season equivalent of this graph had an R2 value of 0.02, and a slope of 0.005, once again suggesting that steals matter more in the playoffs than the regular season.
11. How Have the Relationships Changed Over Time?
In addition to look at the relationship over all seasons, we can also look at how the relationships have changed on a season to season basis. It’s worth noting that unlike the first two part of this series where each season had only 30 teams at most, in this case each season has hundreds of qualified individual players. This means that each season’s relationship is more significant.
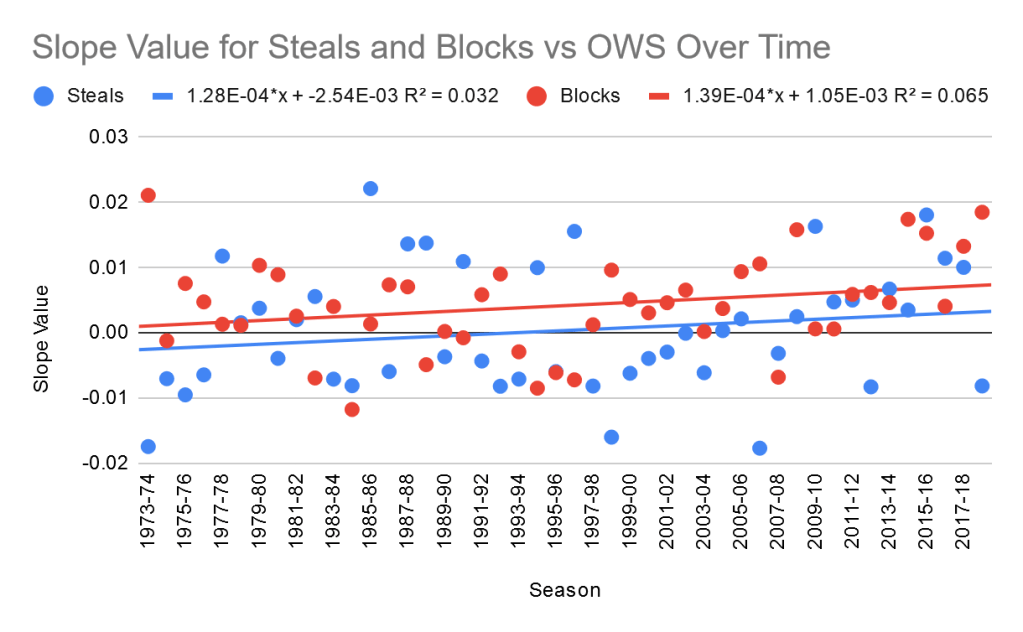
11.1 Slope and R2 Over Time for Playoff Win Shares Per 48
The slope values for both steals and blocks are increasing over time, with blocks maintaining a small but consistent lead. Blocks have been ahead of steals for most of the past 20 seasons, so they’ll likely continue staying ahead.
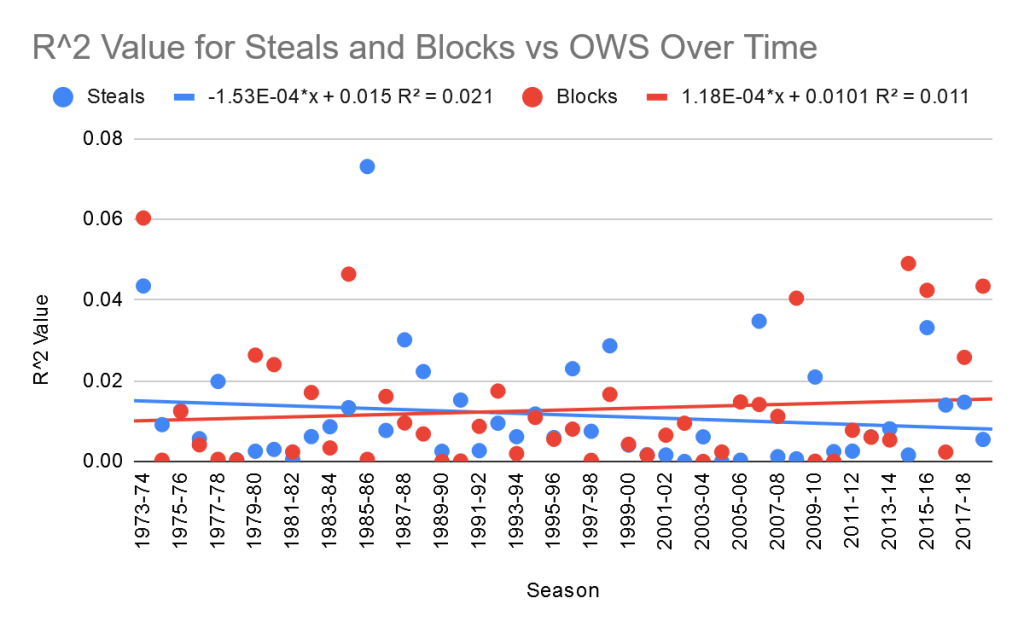
The graph for R2 over time also has blocks with consistently higher values. The R2 values have been increasing for both steals and blocks over time, although there is a lot of season-to-season variation. Also, there seems to be a recent increase in the correlation for blocks, which matches what has been seen in other parts.
11.2 Slope and R2 Over Time for Playoff Offensive Win Shares Per 48
Although blocks still have consistently higher slope values, the values are very low and many are negative. This is expected as we saw there is basically no relationship between steals/blocks and offensive win shares. Blocks haven’t gone negative in the past decade, so it’s possible that they might eventually have a nonnegligible value on offense.
Looking at individual seasons, most of the R2 values are near 0, which is expected. Blocks have had a couple of high correlations recently, but it’s too early to claim that their on a significant upward trend.
11.3 Slope and R2 Over Time for Playoff Offensive Win Shares Per 48
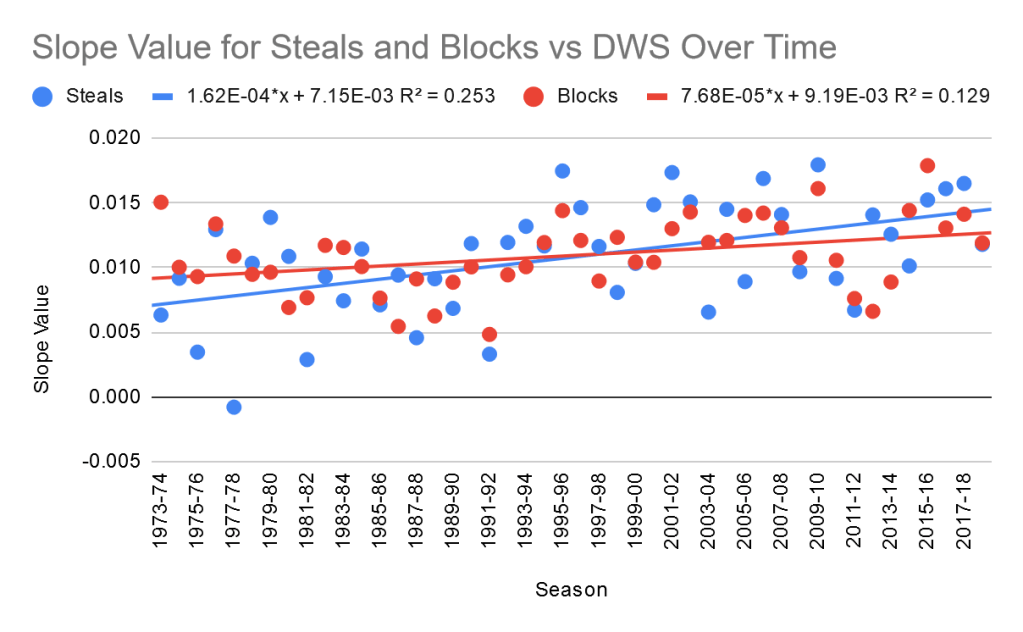
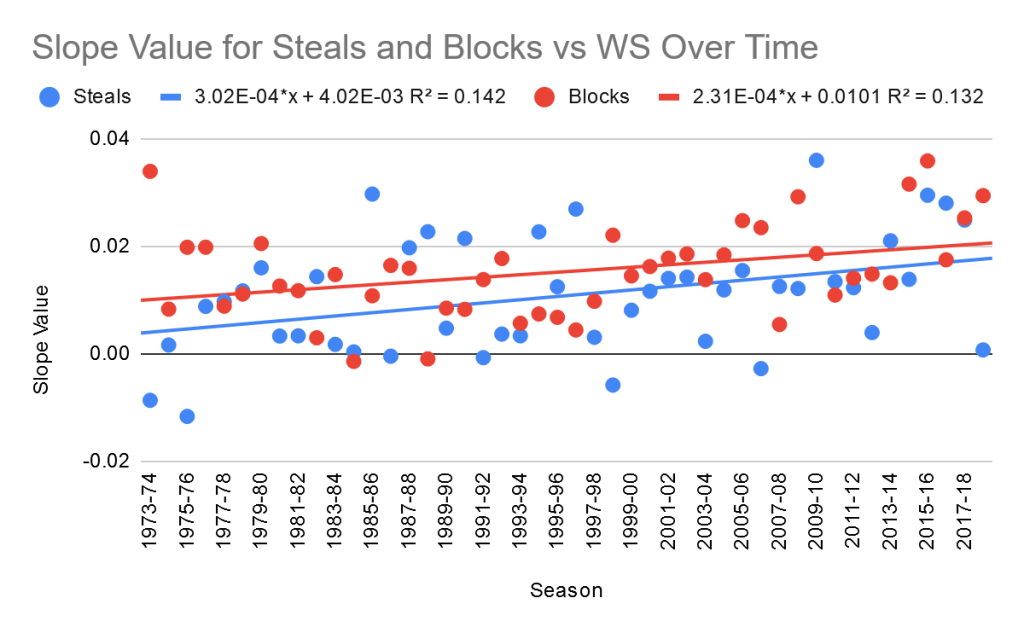
Focusing now on defensive win shares, there seems to be almost no difference between the value of steals and blocks, and steals actually seem to be ahead for the past 10-20 years. Although it’s hard to tell how long this upward trend will last, it definitely looks promising for steals. That said, blocks are also rising, and considering all seasons, it’s very close to a tie between the two.
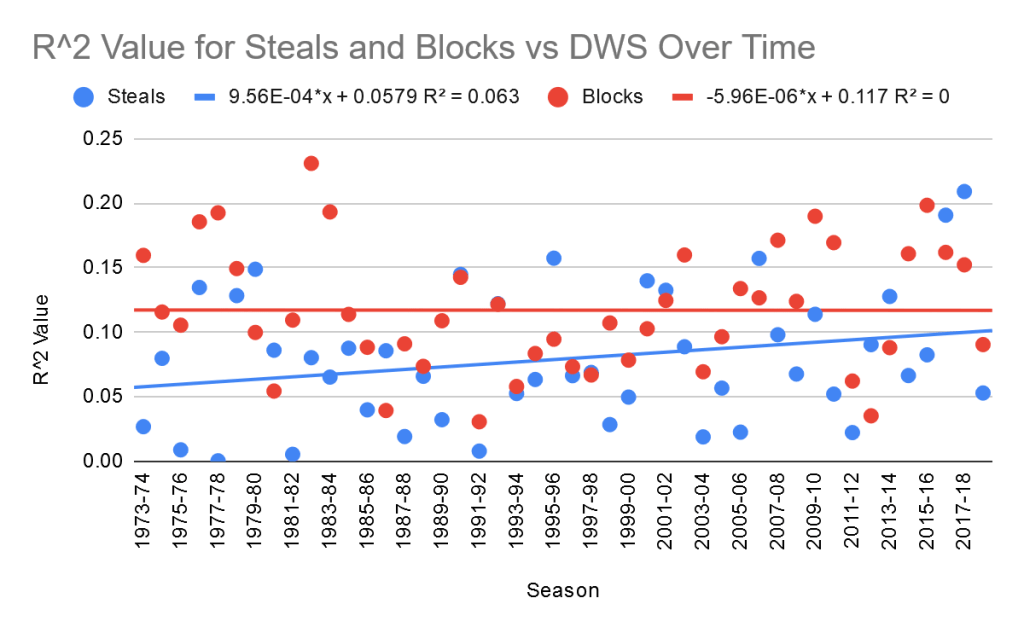
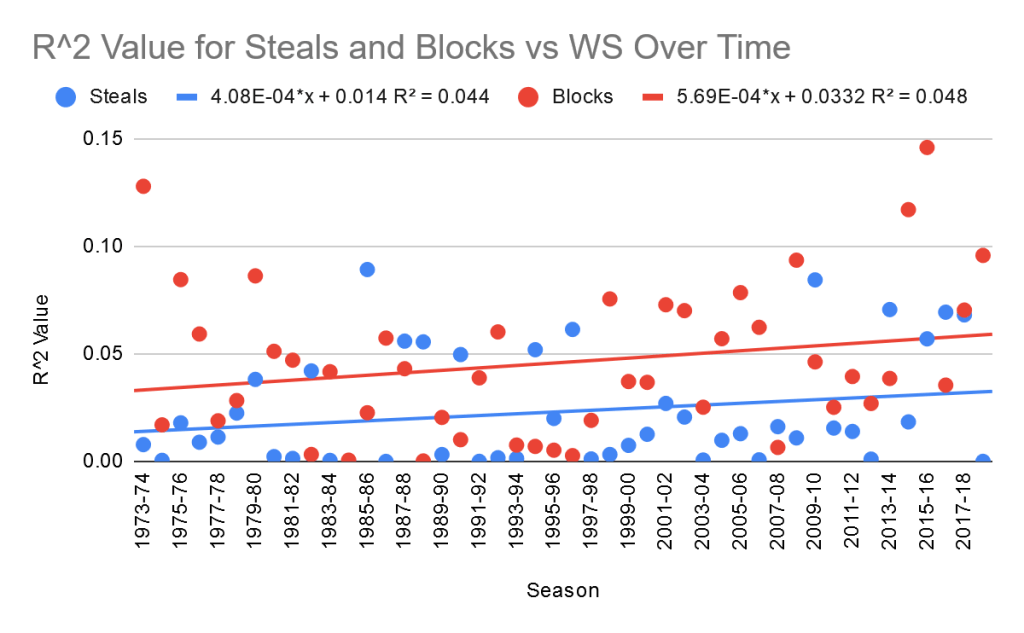
When it comes to correlations, blocks maintain the lead, and steals have had a lot more bad seasons than blocks. However, blocks show no improvement in correlation over time while steals do, so its possible that in a decade steals could take the lead. That said, blocks are ahead for now, and although this part was perhaps the closest, blocks win when it comes to an individual’s playoff success.
12. Verdict
Over all 4 parts, whether it has been regular season or playoffs, an individual player or a team, the value of blocks has always surpassed the value of steals, usually by a large margin. It’s a 4-0 sweep: blocks are more valuable than steals.
