Part 1 covered the relationship between blocks/steals and a team’s regular season success, and part 2 covered the relationship between blocks/steals and a team’s playoff success. In this part, we’ll shift the focus towards analyzing individual players and how their individual success is correlated with blocks and steals.
4. How Blocks and Steals Affect Individual Success
Individual success will be defined as a player’s win shares per 48 minutes. Win shares are an estimate of the number of wins a player contributes to his team in a season, and as a result, a team’s total wins is equal to the sum of each of its players win shares. Win shares per 48 are how many win shares a player gets per 48 minutes, and this is calculated just by scaling their total minutes to 48. We’ll also use steals and blocks per 48 minutes. The reason we’re doing this is to eliminate the confounding factor of minutes played. For example, if we just used win shares and steals/blocks, there would be a very high correlation, but that would mainly be caused by the fact that players who play more minutes both get more win shares and more steals/blocks on average.
Also, we’ll consider every individual season since 1972-73 (the first season steals and blocks were recorded) where a player played at least 30 games and averaged at least 10 minutes per game. This amounts to 12,734 individual seasons, giving a very large sample size. The reason for this is to remove outliers who barely played and got extreme per 48 stats as a result. For example, if a player only played 1 minute in the NBA and got 1 block in that minute, then he’d have 48 blocks per 48, which would be very unsustainable and not something that would be worth considering.
4.1 Wins Shares Per 48 vs Blocks Per 48
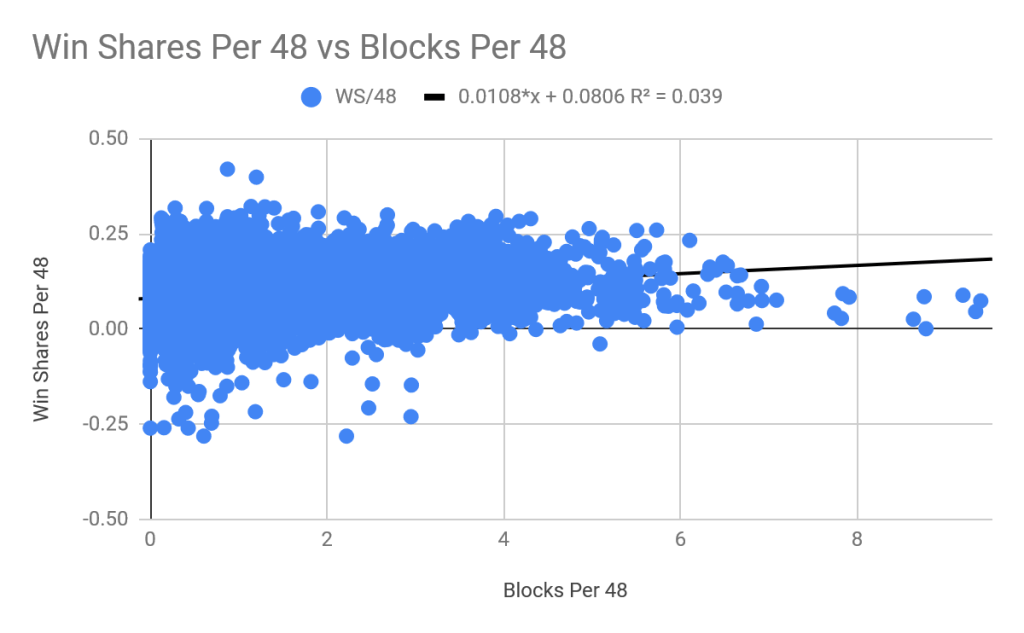
We get an R2 value of .039, meaning that there is a positive but not very significant correlation. Once a player averages 3 or more blocks per 48 they almost always have positive win shares. That said, none of the all time leaders in blocks per 48 were leaders in win shares per 48, meaning that blocks might not matter much after a certain extent. Although the relationship isn’t that strong, it is much better than that of steals.
4.2 Win Shares vs Steals Per Game
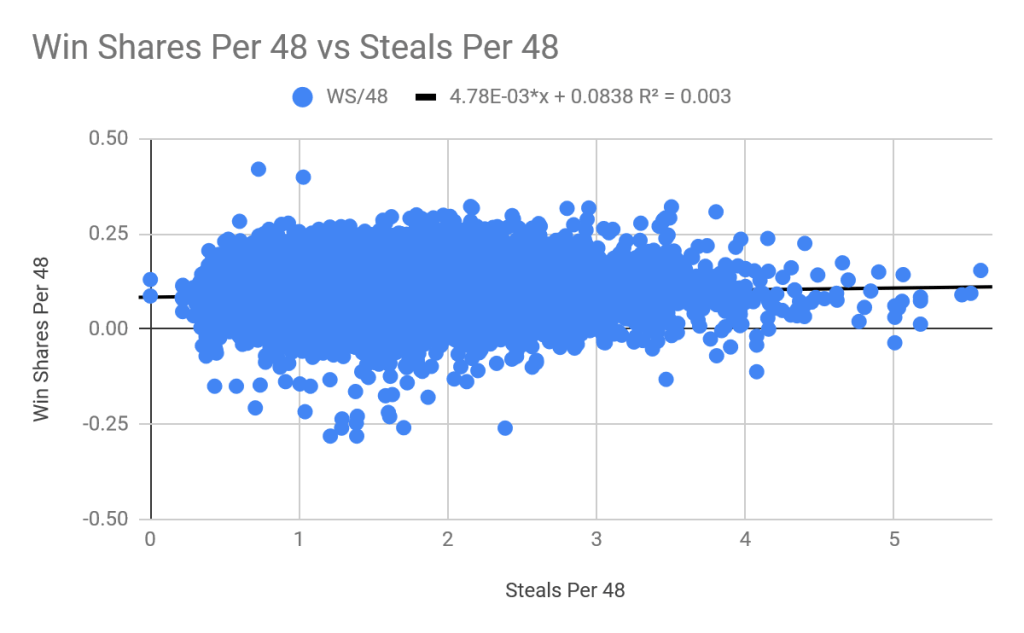
When comparing the graph for steals, the slope is less than half that for blocks and the correlation is less than 1/10 of that of blocks. This suggests that the relationship between steals and individual success is significantly weaker than the relationship between steals and individual success. It seems that this is partially caused from the fact that there were many players with negative win shares and a decent amount of steals but not many players with negative win shares and a decent amount of blocks. In other words, when a player has a lot of blocks he’s usually beneficial to his team, but the same can’t always be said if a player has a lot of steals. It’s also worth noting how almost no players average less than 0.2 steals per 48 but plenty average less than 0.2 blocks per 48.
5. How Blocks and Steals Affect Individual Offensive Success
An interesting thing about a player’s win shares is that they can be divided into offensive and defensive win shares. A players total win shares are the sum of his offensive and defensive win shares. We’ll still use per 48 stats in order to avoid the confounding factor of minutes played.
5.1 Offensive Win Shares Per 48 vs Blocks Per 48
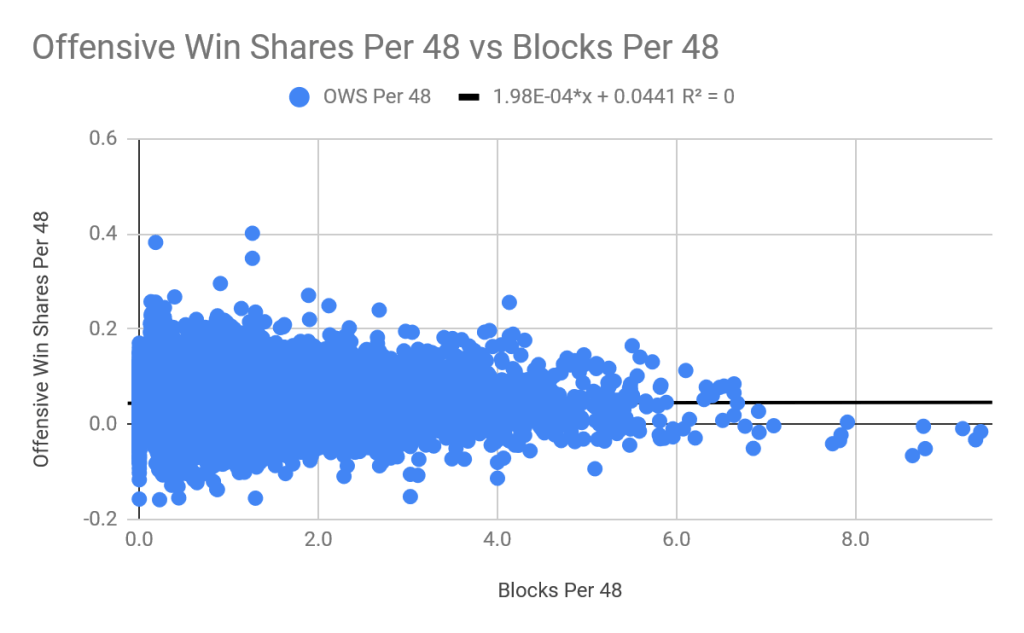
Amazingly, the R2 value rounds down to 0, meaning that there is no statistically significant relationship between individual success and player success. At pretty much any level of blocks per 48, the average offensive win shares per 48 remains essentially unchanged. Furthermore, most of the all-time leaders in blocks actually had slightly negative offensive win shares. When we look at the relationship for steals, it doesn’t get any better.
5.2 Offensive Win Shares Per 48 vs Steals Per 48
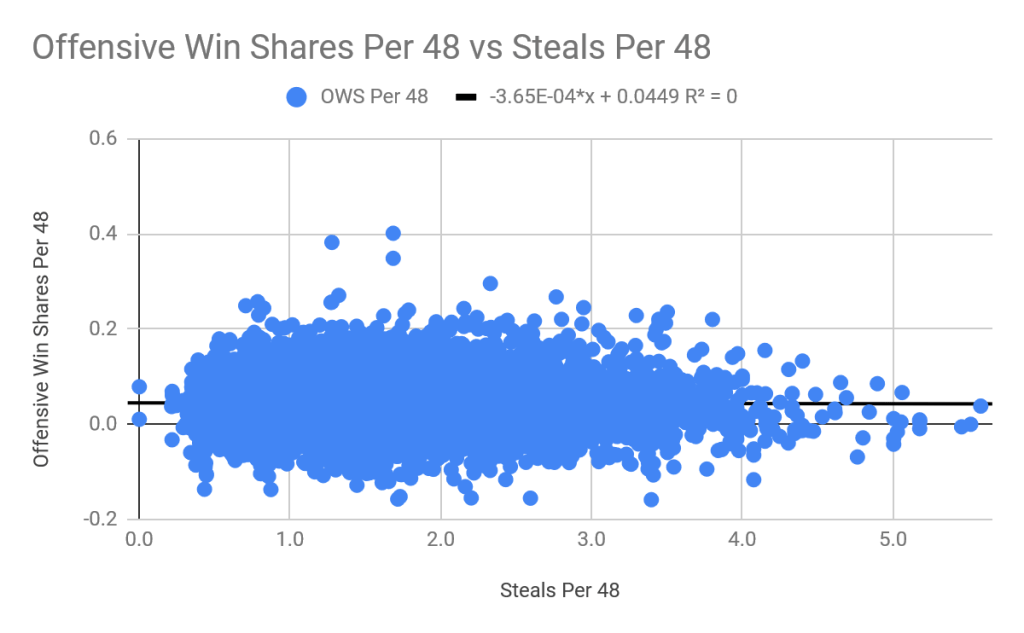
Just like for blocks, the R2 value for steals rounds down to 0. Therefore, neither stat has any correlation with an individual player’s offensive success. Like blocks, for every level of steals per 48, the average offensive win shares per 48 doesn’t change by any significant amount.
6. How Blocks and Steals Affect Individual Defensive Success
We can also look at the other component of win shares: defensive win shares. We expect for there to actually be a relationship here since steals and blocks both occur on defense. Once again, we’ll use per 48 stats.
6.1 Defensive Win Shares Per 48 vs Blocks Per 48
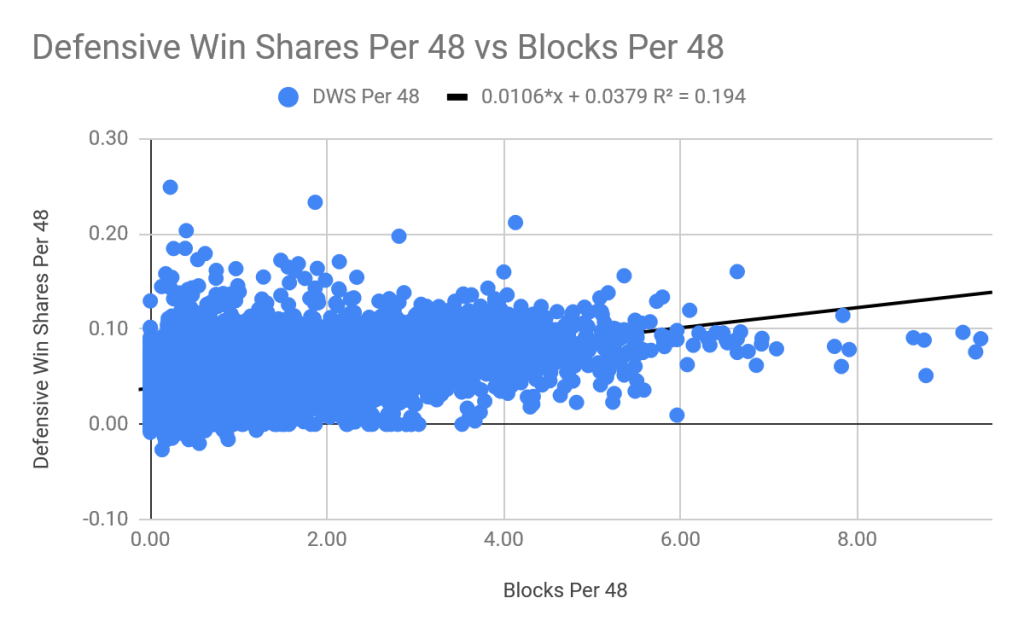
We get a relatively high R2 of 0.194, meaning that about 1/5 of the variation in a player’s defensive success can be explained by their blocks per 48. There are a decent amount of players who don’t average many blocks per 48 and have negative defensive win shares, but once a player’s blocks per 48 goes above 4, they always have positive defensive win shares.
6.2 Defensive Win Shares Per 48 vs Steals Per 48
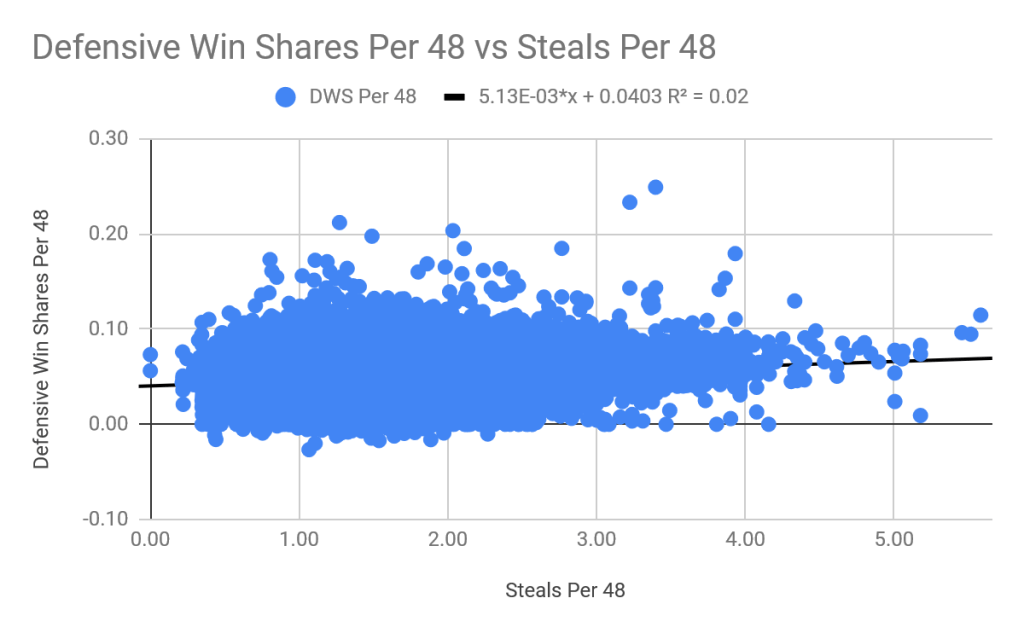
Amazingly, just like with overall win shares, the correlation with defensive win shares per 48 is 1/10 as strong for steals as it is for blocks. There is still a positive correlation, but it is much weaker. Similarly to blocks, after a certain point, enough steals always means positive defensive win shares. Also, the all time leaders in defensive win shares per 48 weren’t all time leaders in steals per 48 or blocks per 48. Still, it’s clear that blocks win this battle.
7. How Have the Relationships Changed Over Time?
In addition to look at the relationship over all seasons, we can also look at how the relationships have changed on a season to season basis. It’s worth noting that unlike the first two part of this series where each season had only 30 teams at most, in this case each season has hundreds of qualified individual players. This means that each season’s relationship is more significant.
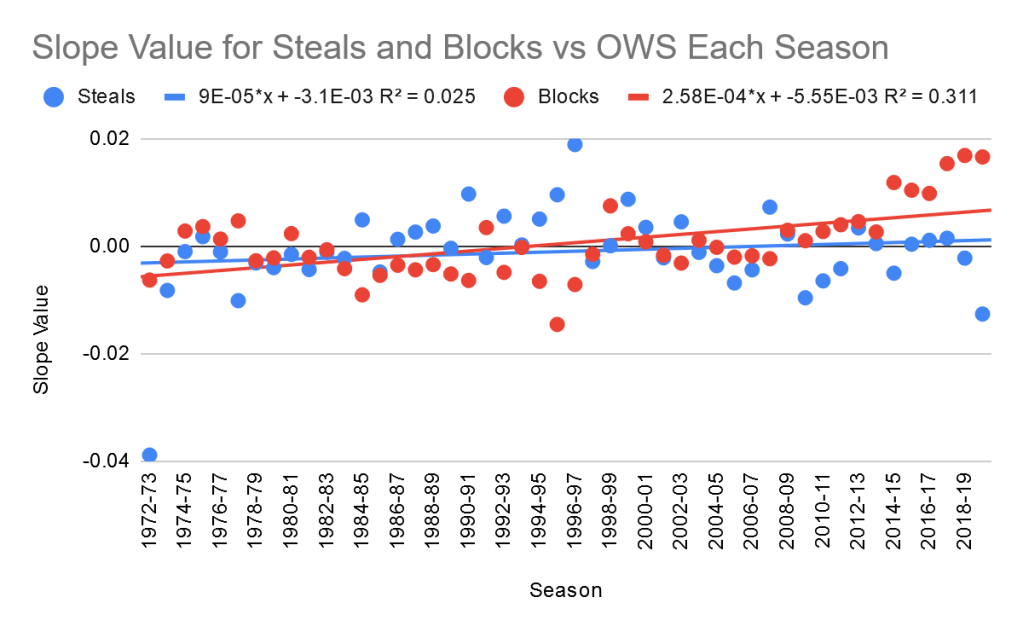
7.1 Slope and R2 Over Time for Win Shares Per 48
The slope value each season represents the expected gain in win shares per 48 if steals/blocks per 48 increase by 1. This essentially means it represents the value of steals/blocks. Also, although a slope of 0.01 for a given season might seem insignificant, it means that an increase in a block/steal per 48 corresponds to a 0.01 increase in win shares per 48, which is significant since it’s a 10% increase on the league average win shares per 48 of 0.1. What we see is that blocks have consistently been ahead of steals, and their value seems to have spiked in the past 6 years.
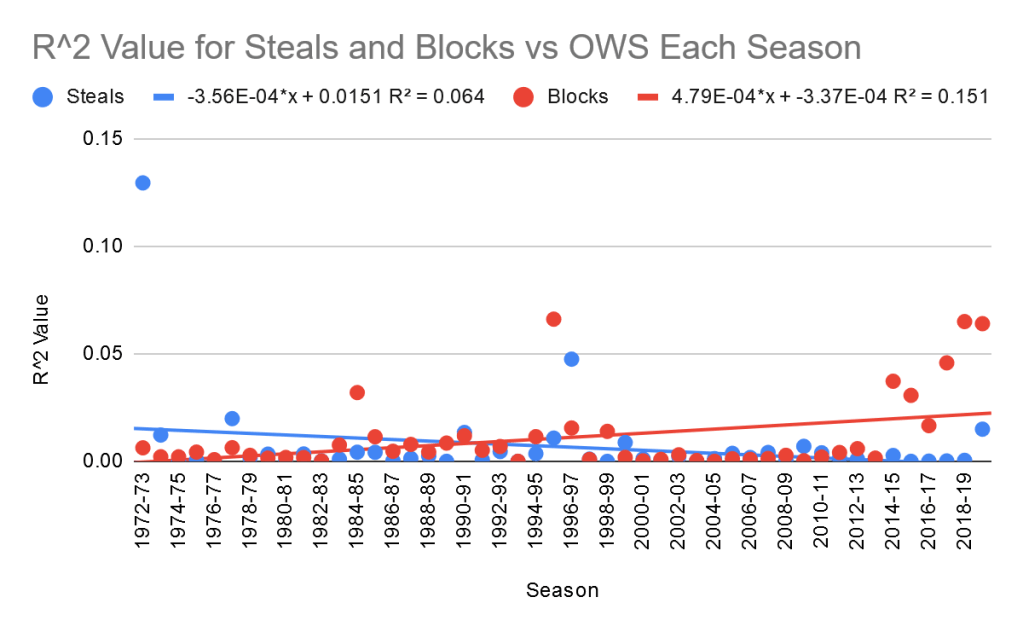
Looking at the R2 values, the correlations for blocks dwarf the correlations for steals. Additionally, the correlations for steals don’t seem to be improving at all. On the other hand, the correlations for blocks have been consistently rising this decade, with a spike happening in the past 6 seasons. Not only are blocks ahead, but they’ll likely continue to widen the gap.
7.2 Slope and R2 Over Time for Offensive Win Shares Per 48
When we looked at all seasons combined, the overall slope was essentially 0, so it makes sense that the slopes over each season are centered around 0. Interestingly, we see the same trend of blocks increasing in value the past 6 seasons, so it’s possible that blocks might actually stay positive in the future. Still, it’s clear that neither stat has had any value to offensive win shares.
We saw that over all seasons, the R2 value was essentially 0, so it makes sense that most individual seasons also have R2 values of 0. It’s clear that knowing a player’s blocks/steals per 48 has very close to no value in being able to predict their offensive success. However, we do see the sudden spike in the correlation of blocks for the past 6 seasons, and it will be interesting to see if the trend continues.
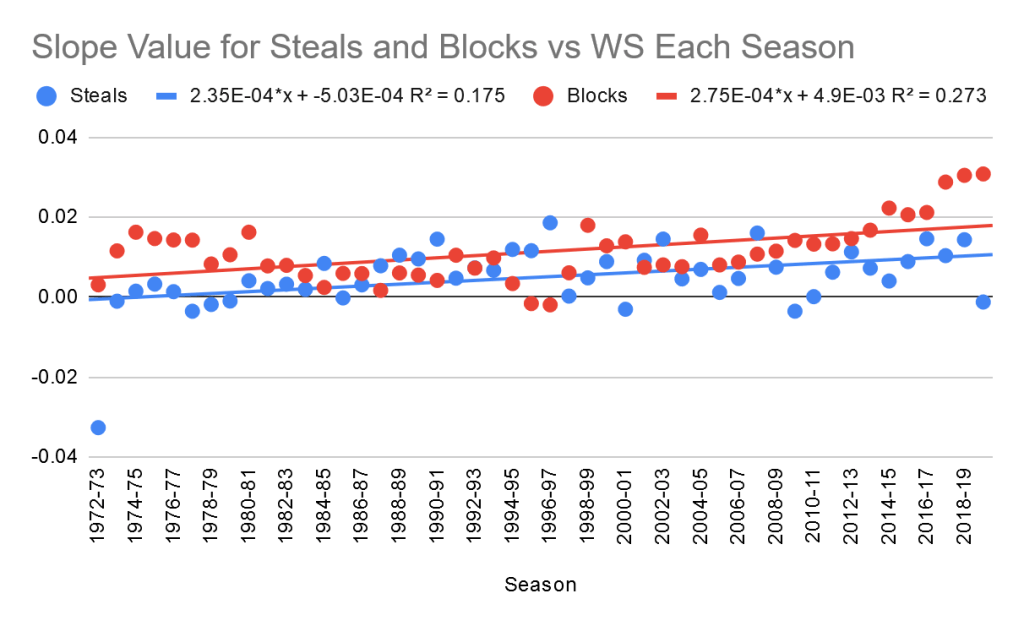
7.3 Slope and R2 Over Time for Defensive Win Shares Per 48
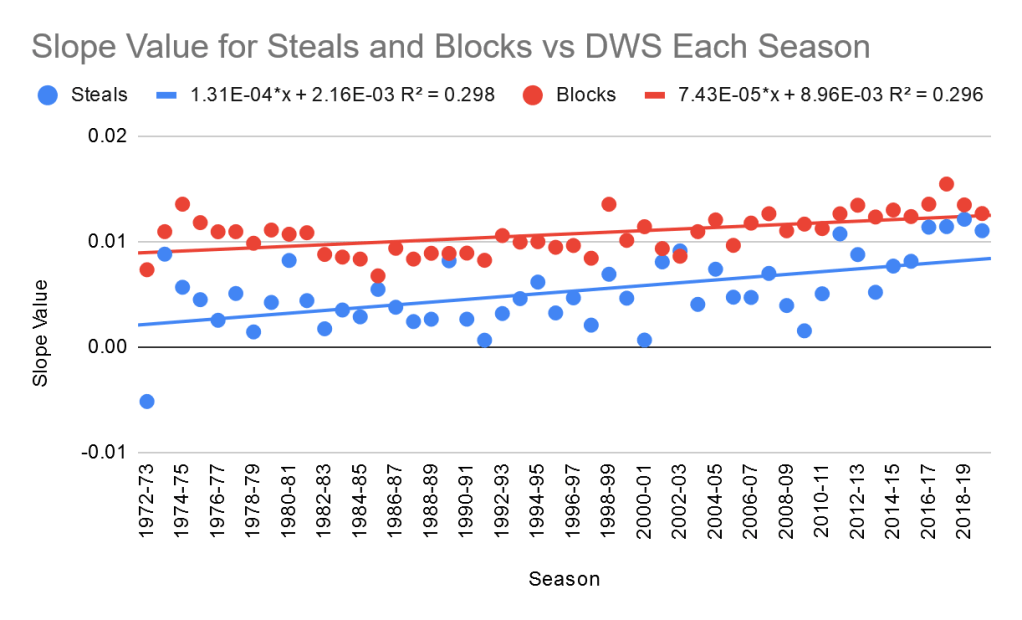
Amazingly, the slope for blocks is higher in ever season except for 2002-03, making it even more convincing that blocks have a higher value. The value of blocks and steals both seem to be going up over time, with steals increasing faster. This means there’s a chance that steals could overtake blocks in the coming seasons, but for now blocks are clearly more valuable when it comes to defensive success.
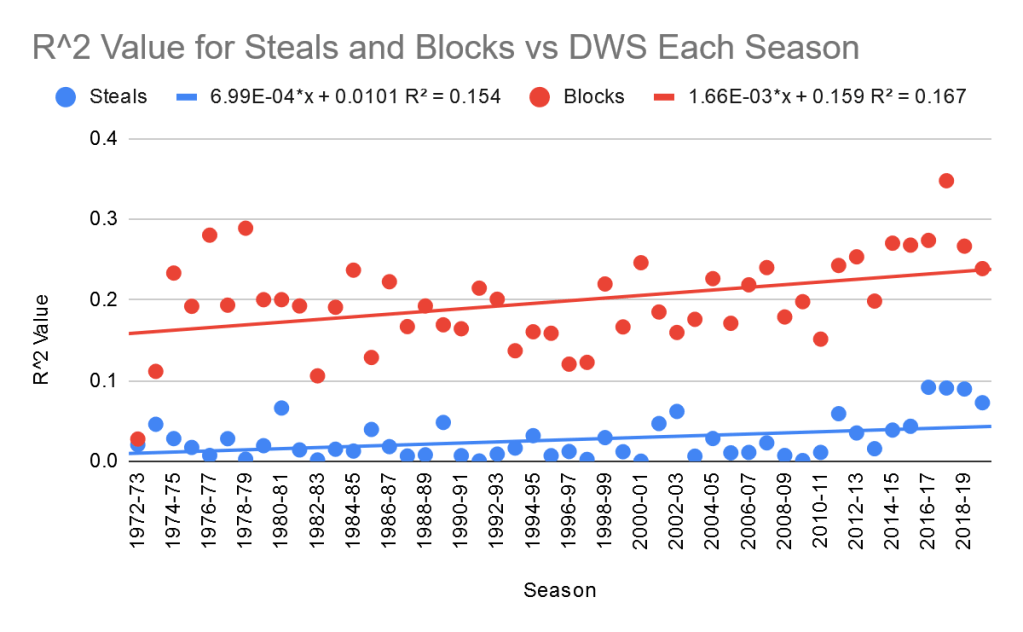
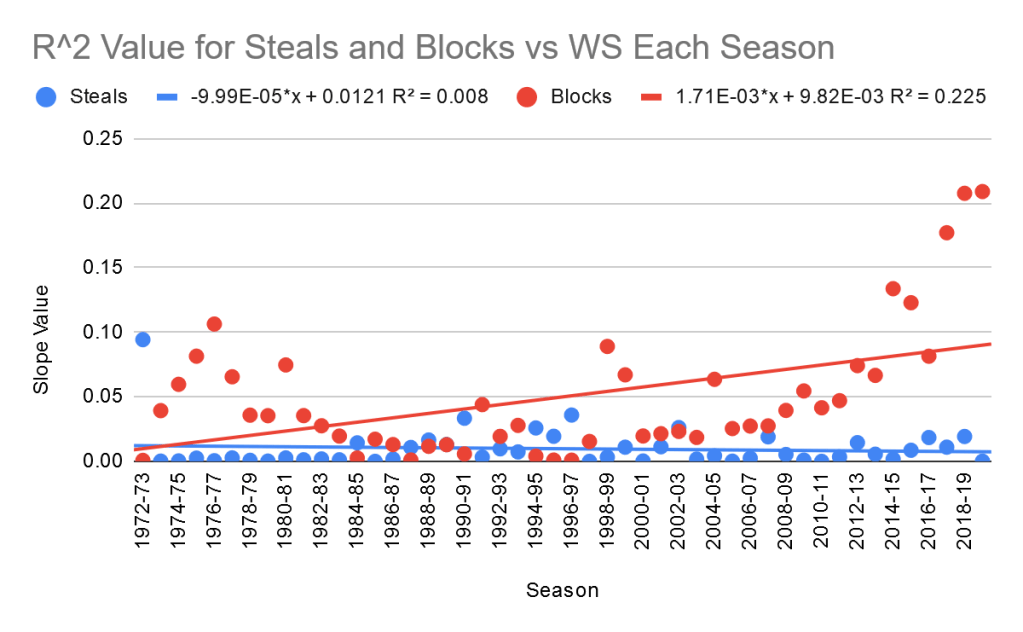
Even more amazingly than the slopes, when it comes to defensive success, blocks have much higher correlations each and every seasons than steals do, and it’s not even close. The correlations for both seem to be increasing slightly over time, and blocks are increasing faster in addition to already being ahead. Interestingly, although we saw spikes in the values and correlations of blocks in the past 6 seasons when we looked at total win shares and offensive win shares, we don’t see any of this when it comes to defensive win shares. This means that the recent spike in the value of blocks is coming entirely from offense, not defense. The cause of this spike is not clear, since there haven’t been any notable rule changes that occurred this decade. Still, it’s clear that blocks are dominant over steals.
What’s Next?
In part 3, we’ve concluded that blocks are more valuable than steals when it comes to a player’s individual regular season success. In part 4 we’ll wrap up the series by comparing the values of steals and blocks when it comes to a player’s individual playoff success.
