In part 1 of this series we analyzed the correlation between a blocks/steals and a team’s regular season success. We’ll now look at the correlation between blocks/steals and a team’s playoff success.
3. How Blocks and Steals affect Playoff Success
Playoff success will be defined to be the number of playoff series that a team wins in a given season. For example, 0 corresponds to a first round loss, and 4 represents a team winning the championship. Only teams that made the playoffs will be considered. Like part 1, we’ll look at the raw stats and the adjusted stats.
3.1 Playoff Series Won vs (adjusted) Playoff Blocks
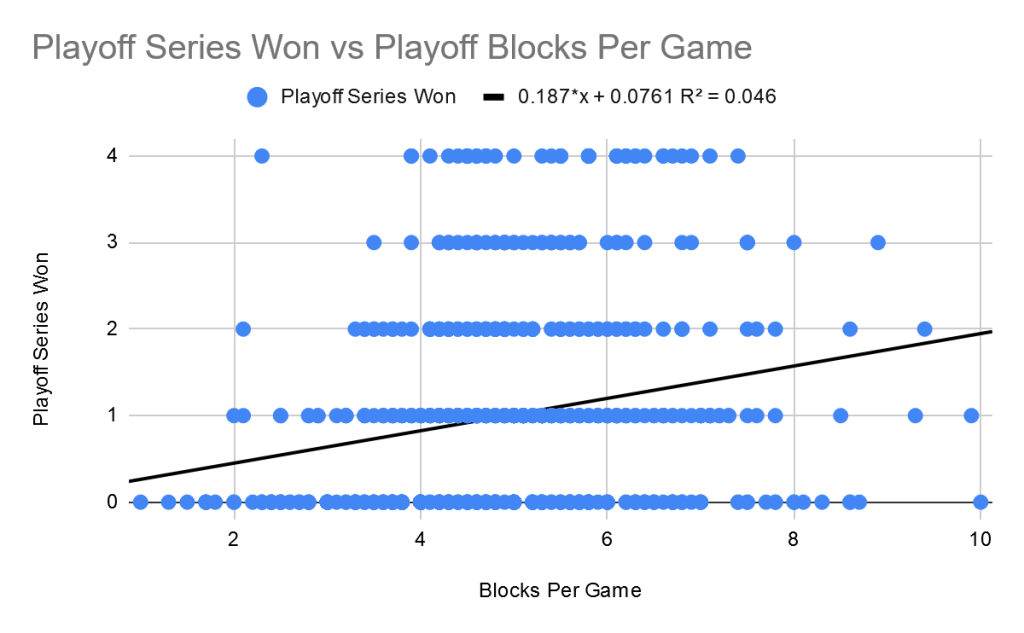
There is a positive but not so strong correlation. Interestingly, a lot of the teams that were on the bottom of the spectrum didn’t have much success. At the same time, although there were a lot of teams that averaged more than 7.5 blocks per game, none of them won the championship.

When looking at adjusted blocks, there isn’t a significant difference in slope or correlation. Still, for every extra playoff series won, there is a clear increase in the average adjusted blocks per game. At the same time, there is less variation as playoff success improves, and although championship teams have the highest average adjusted blocks per game, none of the highest individual teams won a championship.
3.2 Playoff Series Won vs (adjusted) Playoff Steals
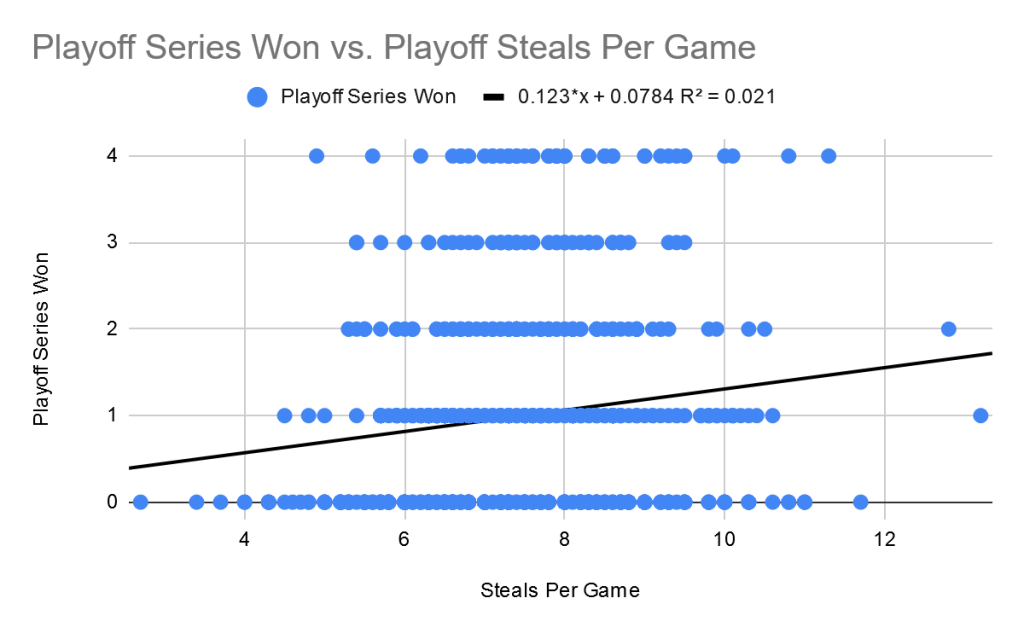
Like with blocks, there is a positive but not very strong correlation between steals and playoff series won. However, the slope and correlation are both lower. One thing that stands out is that there were a lot of teams that averaged less than 6 steals per game, but only two of them won the championship, with many losing in the first round.
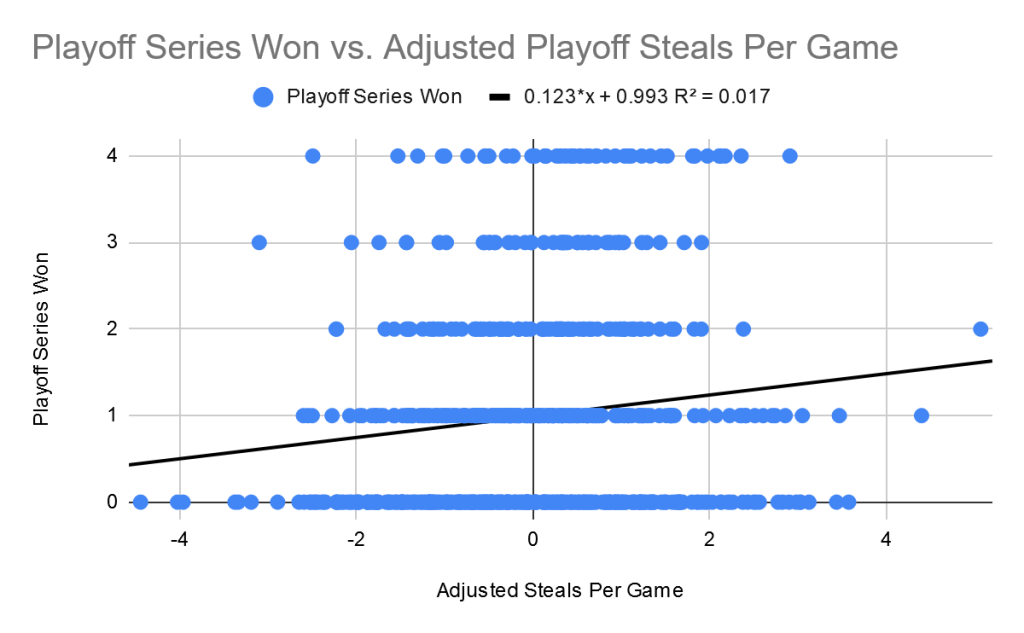
When using adjusted steals, the slope remains unchanged and the correlation slightly decreases. For every playoff series won, the average adjusted steals increase steadily, although there is plenty of variation at each level. What stands out is that for teams that were -2 or worse in adjusted blocks, they almost always were knocked out in the first or second round, suggesting that like blocks, there is a minimum threshold for what a team needs to win a championship.
3.3 How have the Relationships Changed Over Time?
We have the overall picture of how the correlations look for all seasons combined, and we can also look at how they change from season to season. First, we look at the slopes (playoff series won vs adjusted blocks/steals) over time:

The slopes are increasing faster for blocks than for steals, and on average they are higher for blocks. This means that the gap in value might be growing, although it is pretty minor. Also, there’s been many more seasons having negative correlations with steals than having negative correlations with blocks, suggesting that blocks are a more reliable predictor of playoff success.
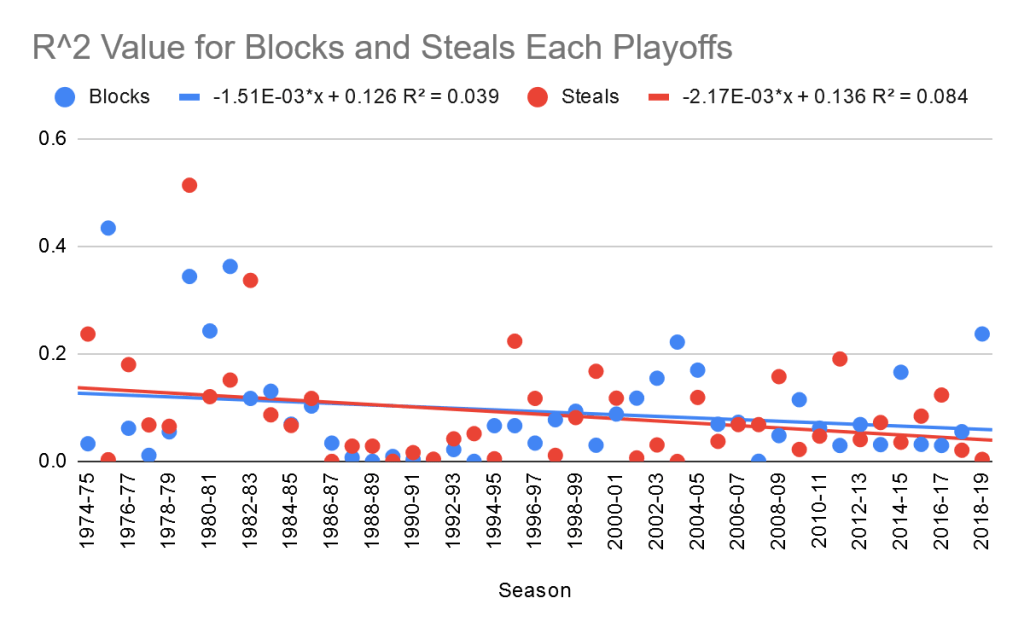
Interestingly, the correlations for steals and for blocks are decreasing over time. This could be due to the high R2 values up until the 1985-86, after which there was a huge drop off. The other thing to notice is that there is a lot of variation from season to season, meaning a stat might be an accurate predictor of success one year but then be nearly irrelevant as a predictor the next year.
What’s Next?
In part 2, we’ve concluded that blocks are more valuable than steals when it comes to a team’s playoff success. In part 3 we’ll compare the values of steals and blocks when it comes to individual player success.
